Industrials › Industrial Instruments For Measurement, Display, And Control

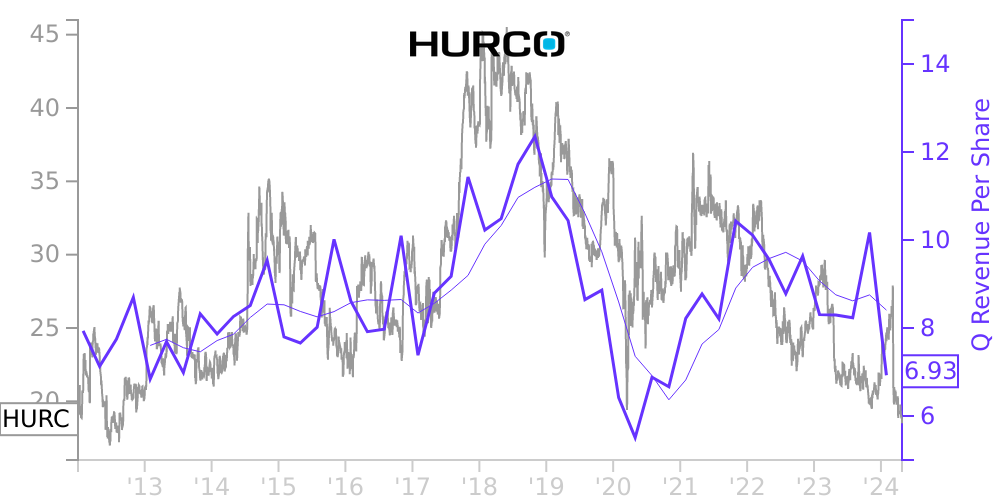
HURC Stock Price Correlated With Hurco Companies Financials
External Links ⌄
Income Statement
Cash Flow
Balance Sheet
HURC Income Statement
Enable JavaScript and reload
Revenue, Net:
Cost of Goods & Services Sold:
Gross Profit:
Selling, General & Admin Expense:
Research & Development Expense:
Total Operating Expenses:
Operating Income:
Income Taxes:
Net Income:
HURC Cash Flow
Enable JavaScript and reload
Operating Activities Net Income:
Depreciation, Depletion & Amortization:
Change in Accounts Receiveable:
Net Cash from Operations:
Repurchases/Buybacks Common Stock:
Issuance of Long-term Debt:
Cash Dividends Paid:
Net Cash from Financing Activities:
Property, Plant & Equipment Purchases:
Purchases of Businesses, Net of Cash:
Net Cash from Investing Activities:
Net Change in Cash & Equivalents:
HURC Balance Sheet
Enable JavaScript and reload
Cash and Cash Equivalents:
Short-Term Investments:
Accounts Receivable, Net:
Inventories:
Total Current Assets:
Property, Plant & Equipment, Net:
Total Assets:
Accounts Payable:
Current Portion of Long-Term Debt:
Total Short-Term Liabilities:
Long Term Debt, Non-Current Portion:
Total Long-Term Liabilities:
Total Liabilities:
COMPANY PROFILE
2. BUSINESS OPERATIONS Nature of Business . We design, manufacture, and sell computerized CNC machine tools, computer control systems and software products, machine tool components, automation integration equipment and solutions for job shops, software options, control upgrades, accessories and replacement parts for our products, as well as customer service, training, and applications support, to companies in the metal cutting industry through a worldwide sales, service, and distribution network. The machine tool industry is highly cyclical and changes in demand can occur abruptly in the geographic markets we serve. As a result of this cyclicality, we have experienced significant fluctuations in our sales, which, in periods of reduced demand, have adversely affected our results of operations and financial condition. The end market for our products consists primarily of precision tool, die and mold manufacturers, independent job shops, and specialized short–run production applications within large manufacturing operations. Industries served include: aerospace, defense, medical equipment, energy, automotive/transportation, electronics, and computer industries. Our products are sold principally through more than 180 independent agents and distributors throughout the Americas, Europe and Asia. We also have our own direct sales and service organizations in China, France, Germany, India, Italy, the Netherlands, Poland, Singapore, Taiwan, the United Kingdom, and certain areas of the United States. We operate in the industrial equipment industry and have a global footprint that subjects us to various business risks in many different countries. During fiscal 2020, our operating results were adversely affected by the international business disruption due to the outbreak of COVID-19 and the economic slowdown in Europe, uncertainty surrounding the U.K. Brexit activities, and political friction in the U.S. Many of our customers deferred or eliminated investments in capital equipment last year, which we attributed largely to the uncertainty these events created. During fiscal 2021, our sales increased year-over-year in all regions as countries began to lift the government-mandated COVID-19 stay-at-home orders or other similar operating restrictions. Because of the potential for extended vulnerability, we have closely evaluated the estimates we have made in preparing the financial statements as of October 31, 2021, with the understanding that these estimates could change in the near term. We will continue to evaluate and disclose any uncertainty associated with key assumptions underlying fair value estimates, trends, and uncertainties that have had, or are reasonably expected to have, a material effect on our consolidated financial position, results of operations, changes in shareholders' equity, and cash flows for and at the end of each interim period. Credit Risk . We sell products to customers located throughout the world. We perform ongoing credit evaluations of customers and generally do not require collateral. Allowances are maintained for potential credit losses. Concentration of credit risk with respect to trade accounts receivable is limited due to the large number of customers and their dispersion across many geographic areas. Although a significant amount of trade receivables are with distributors primarily located in the United States, no single distributor or region represents a significant concentration of credit risk. Manufacturing Risk. At present, our wholly–owned subsidiaries, Hurco Manufacturing Limited (“HML”), Ningbo Hurco Machine Tool Co., Ltd. (“NHML”), and Milltronics USA, Inc. (“Milltronics”) produce the vast majority of our machine tools for all three brands, Hurco, Milltronics, and Takumi. In addition, we manufacture electro–mechanical components and accessories for machine tools through our wholly–owned subsidiary, LCM. HML, NHML, Milltronics, and LCM manufacture their products in Taiwan, China, the U.S., and I
Free historical financial statements for Hurco Companies Inc. See how revenue, income, cash flow, and balance sheet financials have changed over 58 quarters since 2012. Compare with HURC stock chart to see long term trends.
Data imported from Hurco Companies Inc SEC filings. Check original filings before making any investment decision.