Energy › Water Transportation

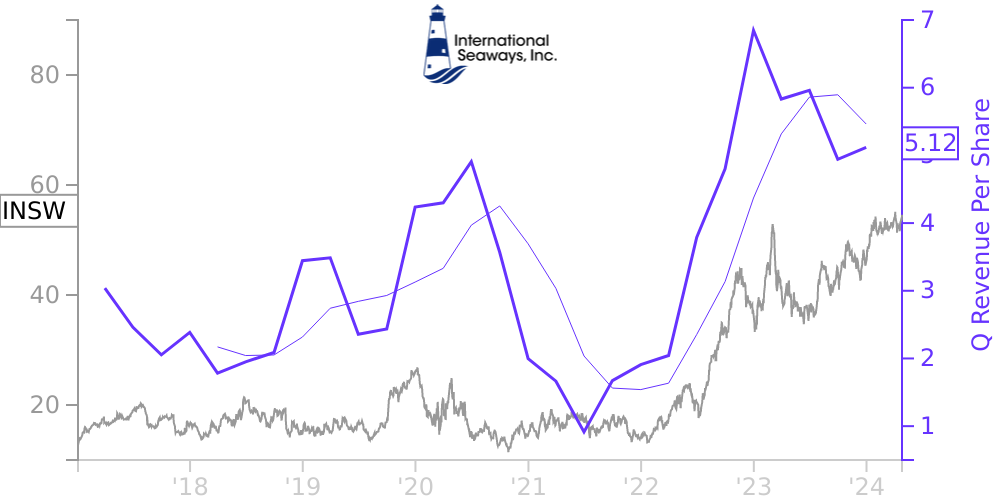
INSW Stock Price Correlated With International Seaways Financials
External Links ⌄
Income Statement
Cash Flow
Balance Sheet
INSW Income Statement
Enable JavaScript and reload
Revenue, Net:
Cost of Goods & Services Sold:
Gross Profit:
Selling, General & Admin Expense:
Research & Development Expense:
Total Operating Expenses:
Operating Income:
Income Taxes:
Net Income:
INSW Cash Flow
Enable JavaScript and reload
Operating Activities Net Income:
Depreciation, Depletion & Amortization:
Change in Accounts Receiveable:
Net Cash from Operations:
Repurchases/Buybacks Common Stock:
Issuance of Long-term Debt:
Cash Dividends Paid:
Net Cash from Financing Activities:
Property, Plant & Equipment Purchases:
Purchases of Businesses, Net of Cash:
Net Cash from Investing Activities:
Net Change in Cash & Equivalents:
INSW Balance Sheet
Enable JavaScript and reload
Cash and Cash Equivalents:
Short-Term Investments:
Accounts Receivable, Net:
Inventories:
Total Current Assets:
Property, Plant & Equipment, Net:
Total Assets:
Accounts Payable:
Current Portion of Long-Term Debt:
Total Short-Term Liabilities:
Long Term Debt, Non-Current Portion:
Total Long-Term Liabilities:
Total Liabilities:
COMPANY PROFILE
NOTE 1 — DESCRIPTION OF BUSINESS AND BASIS OF PRESENTATION: Nature of the Business International Seaways, Inc. (“INSW”), a Marshall Islands corporation, and its wholly owned subsidiaries (the “Company” or “INSW,” or “we” or “us” or “our”) are engaged primarily in the ocean transportation of crude oil and petroleum products in international markets. The Marshall Islands is the principal flag of registry of the Company’s vessels. The Company’s business is currently organized into two reportable segments: Crude Tankers and Product Carriers. The crude oil fleet is comprised of most major crude oil vessel classes. The products fleet transports refined petroleum product cargoes from refineries to consuming markets characterized by both long and short-haul routes. As of December 31, 2021, the Company owned and operated a fleet of 83 oceangoing vessels, including 12 vessels that have been chartered-in under leases and two vessels in which the Company has interests through its joint ventures, engaged primarily in the transportation of crude oil and refined petroleum products in the International Flag trade through its wholly owned subsidiaries. In addition to its operating fleet of 83 vessels, three dual-fuel LNG VLCC newbuilds are scheduled for delivery to the Company in the first quarter of 2023, bringing the total operating and newbuild fleet to 86 vessels as of December 31, 2021. The Company’s operating fleet list excludes vessels chartered-in where the duration of the charter was one year or less at inception. Vessels chartered-in may be bareboat charters or time charters. Under either a bareboat charter or time charter, a customer pays a daily or monthly rate for a fixed period of time for use of the vessel. Under a bareboat charter, the customer pays all costs of operating the vessel, including voyage expenses, such as fuel, canal tolls and port charges, and vessel expenses such as crew costs, vessel stores and supplies, lubricating oils, maintenance and repair, insurance and communications associated with operating the vessel. Under a time charter, the customer pays all voyage expenses and the shipowner pays all vessel expenses. Basis of Presentation The accompanying consolidated financial statements include the accounts of the Company and its wholly owned subsidiaries. All intercompany balances and transactions within the Company have been eliminated. Investments in 50% or less owned affiliated companies, in which the Company exercises significant influence, are accounted for by the equity method.
Free historical financial statements for International Seaways Inc. See how revenue, income, cash flow, and balance sheet financials have changed over 37 quarters since 2017. Compare with INSW stock chart to see long term trends.
Data imported from International Seaways Inc SEC filings. Check original filings before making any investment decision.