Technology › Services-Advertising

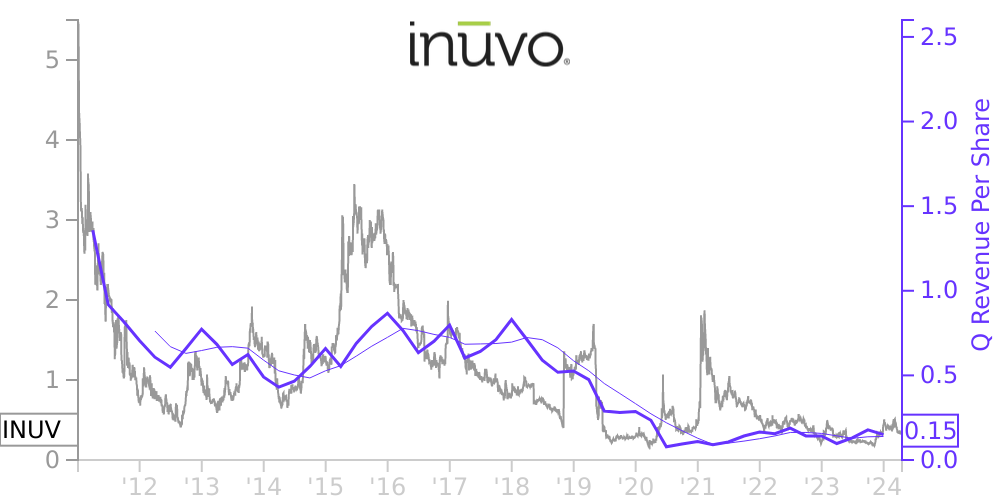
INUV Stock Price Correlated With Inuvo Financials
External Links ⌄
Income Statement
Cash Flow
Balance Sheet
INUV Income Statement
Enable JavaScript and reload
Revenue, Net:
Cost of Goods & Services Sold:
Gross Profit:
Selling, General & Admin Expense:
Research & Development Expense:
Total Operating Expenses:
Operating Income:
Income Taxes:
Net Income:
INUV Cash Flow
Enable JavaScript and reload
Operating Activities Net Income:
Depreciation, Depletion & Amortization:
Change in Accounts Receiveable:
Net Cash from Operations:
Repurchases/Buybacks Common Stock:
Issuance of Long-term Debt:
Cash Dividends Paid:
Net Cash from Financing Activities:
Property, Plant & Equipment Purchases:
Purchases of Businesses, Net of Cash:
Net Cash from Investing Activities:
Net Change in Cash & Equivalents:
INUV Balance Sheet
Enable JavaScript and reload
Cash and Cash Equivalents:
Short-Term Investments:
Accounts Receivable, Net:
Inventories:
Total Current Assets:
Property, Plant & Equipment, Net:
Total Assets:
Accounts Payable:
Current Portion of Long-Term Debt:
Total Short-Term Liabilities:
Long Term Debt, Non-Current Portion:
Total Long-Term Liabilities:
Total Liabilities:
COMPANY PROFILE
Organization and Business
Company Overview
Inuvo is a technology company that develops and sells information technology solutions for marketing and advertising. These solutions predictively identify and message online audiences for any product or service across devices, formats, and channels including video, mobile, connected TV, linear TV, display, social, search and native. These solutions allow Inuvo’s clients to engage with their customers and prospects in a manner that drives responsiveness. Inuvo facilitates the delivery of hundreds of millions of marketing messages to consumers every single month and counts among its clients numerous world- renowned names across industries.
The Inuvo solution incorporates a proprietary form of artificial intelligence, or AI, branded the IntentKey. This patented machine learning technology uses interactions with Internet content as a source of information from which to predict consumer intent. The AI can identify and advertise to the reasons why consumers are purchasing products and services not who those consumers are. In this regard, the technology is designed for a privacy conscious future and focused on the components of the advertising value chain most responsible for return on advertising spend, the intelligence behind the advertising decision.
Inuvo technology can be consumed both as a managed service and software-as-a-service. For clients, Inuvo has also developed a collection of propriety websites collectively branded as Bonfire Publishing where content is created specifically to attract qualified consumer traffic for clients through the publication of information across a wide range of topics including health, finance, travel, careers, auto, education and lifestyle. These sites also provide the means to market test various Inuvo advertising technologies.
There are many barriers to entry associated with the Inuvo business model, including a proficiency in large scale information processing, predictive software development, marketing data products, analytics, artificial intelligence, integration to the internet of things ("IOT"), and the relationships required to execute within the IOT. Inuvo’s intellectual property is protected by 17 issued and eight pending patents.
Liquidity
As of December 31, 2021, we have approximately $13.3 million in cash, cash equivalents and marketable securities. Our net working capital was $12.4 million. We have encountered recurring losses and cash outflows from operations, which historically we have funded through equity offerings and debt facilities. In addition, our investment in internally developed software consists primarily of labor costs which are of a fixed nature. Through December 31, 2021, our accumulated deficit was $144.0 million.
Our principal sources of liquidity are the sale of our common stock and our credit facility with Hitachi described in Note 7 to
our Consolidated Financial Statements. During March 2020 and April 2020, we raised approximately $1.5 million in gross
proceeds, before expenses, through sales of our common stock and in April 2020 we received a $1.1 million PPP Loan. On June
8, 2020, we raised an additional $5.5 million in gross proceeds, before expenses, through the sale of our common stock and on
July 27, 2020, we raised an additional $10.75 million in gross proceeds, before expenses, through sales of our common stock.
On January 19, 2021, we raised an additional $8 million in gross proceeds, before expenses, through the sale of our common
stock, and on January 22, 2021, we raised an additional $6.25 million in gross proceeds, before expenses, through sales of our
common stock.
In March 2021, we contracted with an investment management company to manage our cash in excess of current operating
needs. We placed $2 million in cash equivalent accounts and $10 million in an interest-bearing account. At December 31, 2021,
our funds with the investment management company were approximately $8 million an
Free historical financial statements for Inuvo Inc. See how revenue, income, cash flow, and balance sheet financials have changed over 57 quarters since 2011. Compare with INUV stock chart to see long term trends.
Data imported from Inuvo Inc SEC filings. Check original filings before making any investment decision.