Materials › Chemicals And Allied Products

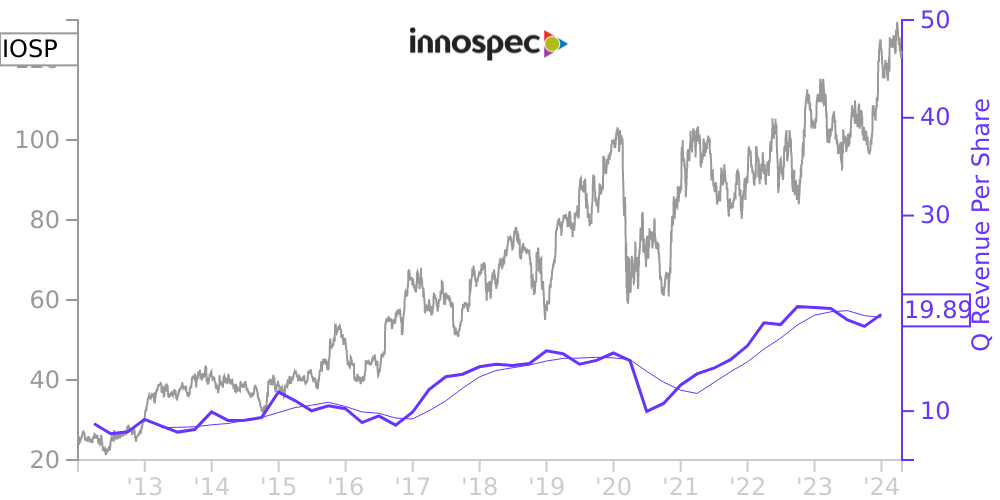
IOSP Stock Price Correlated With Innospec Financials
External Links ⌄
Income Statement
Cash Flow
Balance Sheet
IOSP Income Statement
Enable JavaScript and reload
Revenue, Net:
Cost of Goods & Services Sold:
Gross Profit:
Selling, General & Admin Expense:
Research & Development Expense:
Total Operating Expenses:
Operating Income:
Income Taxes:
Net Income:
IOSP Cash Flow
Enable JavaScript and reload
Operating Activities Net Income:
Depreciation, Depletion & Amortization:
Change in Accounts Receiveable:
Net Cash from Operations:
Repurchases/Buybacks Common Stock:
Issuance of Long-term Debt:
Cash Dividends Paid:
Net Cash from Financing Activities:
Property, Plant & Equipment Purchases:
Purchases of Businesses, Net of Cash:
Net Cash from Investing Activities:
Net Change in Cash & Equivalents:
IOSP Balance Sheet
Enable JavaScript and reload
Cash and Cash Equivalents:
Short-Term Investments:
Accounts Receivable, Net:
Inventories:
Total Current Assets:
Property, Plant & Equipment, Net:
Total Assets:
Accounts Payable:
Current Portion of Long-Term Debt:
Total Short-Term Liabilities:
Long Term Debt, Non-Current Portion:
Total Long-Term Liabilities:
Total Liabilities:
COMPANY PROFILE
NOTE 1 – BASIS OF PRESENTATION
The accompanying unaudited interim condensed consolidated financial statements have been prepared in accordance with generally accepted accounting principles in the United States of America for interim financial information and with the instructions to Form 10-Q
and Article 10 of Regulation S-X
under the Securities Exchange Act of 1934. Accordingly, they do not include all the information and notes necessary for a comprehensive presentation of financial position, results of operations and cash flows.
It is our opinion, however, that all adjustments (consisting of normal, recurring adjustments, unless otherwise disclosed) have been made which are necessary for the condensed consolidated financial statements to be fairly stated. These condensed consolidated financial statements should be read in conjunction with the consolidated financial statements and notes thereto included in the Company’s Annual Report on Form 10-K
for the year ended December 31, 2021 filed on February 16, 2022 (the “2021 Form 10-K”).
The results for the interim period covered by this report are not necessarily indicative of the results to be expected for the full year.
When we use the terms “Innospec,” “the Corporation,” “the Company,” “Registrant,” “we,” “us” and “our,” we are referring to Innospec Inc. and its consolidated subsidiaries unless otherwise indicated or the context otherwise requires.
Free historical financial statements for Innospec Inc. See how revenue, income, cash flow, and balance sheet financials have changed over 57 quarters since 2012. Compare with IOSP stock chart to see long term trends.
Data imported from Innospec Inc SEC filings. Check original filings before making any investment decision.