Consumer Discretionary › Games, Toys And Children'S Vehicles (No Dolls And Bicycles)

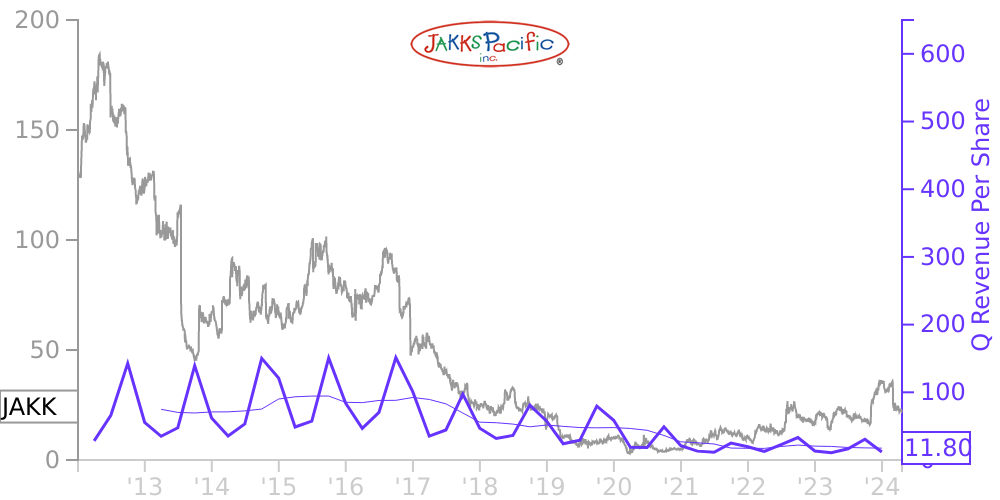
JAKK Stock Price Correlated With JAKKS Pacific Financials
External Links ⌄
Income Statement
Cash Flow
Balance Sheet
JAKK Income Statement
Enable JavaScript and reload
Revenue, Net:
Cost of Goods & Services Sold:
Gross Profit:
Selling, General & Admin Expense:
Research & Development Expense:
Total Operating Expenses:
Operating Income:
Income Taxes:
Net Income:
JAKK Cash Flow
Enable JavaScript and reload
Operating Activities Net Income:
Depreciation, Depletion & Amortization:
Change in Accounts Receiveable:
Net Cash from Operations:
Repurchases/Buybacks Common Stock:
Issuance of Long-term Debt:
Cash Dividends Paid:
Net Cash from Financing Activities:
Property, Plant & Equipment Purchases:
Purchases of Businesses, Net of Cash:
Net Cash from Investing Activities:
Net Change in Cash & Equivalents:
JAKK Balance Sheet
Enable JavaScript and reload
Cash and Cash Equivalents:
Short-Term Investments:
Accounts Receivable, Net:
Inventories:
Total Current Assets:
Property, Plant & Equipment, Net:
Total Assets:
Accounts Payable:
Current Portion of Long-Term Debt:
Total Short-Term Liabilities:
Long Term Debt, Non-Current Portion:
Total Long-Term Liabilities:
Total Liabilities:
COMPANY PROFILE
Note 1 — Basis of Presentation The accompanying unaudited interim condensed consolidated financial statements included herein have been prepared by the Company, without audit, pursuant to the rules and regulations of the Securities and Exchange Commission (the “SEC”). Certain information and footnote disclosures normally included in financial statements prepared in accordance with accounting principles generally accepted in the United States of America have been condensed or omitted pursuant to such rules and regulations. However, the Company believes that the disclosures are adequate to prevent the information presented from being misleading. These financial statements should be read in conjunction with the financial statements and the notes thereto included in the Company’s Annual Report on Form 10-K, which contains audited financial information for the three years in the period ended December 31, 2021. The information provided in this report reflects all adjustments (consisting solely of normal recurring items) that are, in the opinion of management, necessary to present fairly the financial position and the results of operations for the periods presented. Interim results are not necessarily, especially given seasonality, indicative of results to be expected for a full year. The condensed consolidated financial statements include the accounts of JAKKS Pacific, Inc. and its wholly-owned subsidiaries (collectively, “the Company”). The condensed consolidated financial statements also include the accounts of DreamPlay Toys, LLC, a joint venture with NantWorks LLC, JAKKS Meisheng Trading (Shanghai) Limited, a joint venture with Meisheng Cultural & Creative Corp., Ltd., and JAKKS Meisheng Animation (HK) Limited, a joint venture with Hong Kong Meisheng Cultural Company Limited. Effective July 9, 2020, the Company completed a 1 for 10 reverse stock split of its $0.001 par value common stock reducing the issued and outstanding shares of common stock from 42,395,782 to 4,239,578 (“Reverse Stock Split”). The Reverse Stock Split did not cause an adjustment to the par value or the authorized shares of the common stock. All share and per share amounts in the financial statements and notes thereto have been retroactively adjusted for all periods presented to give effect to the Reverse Stock Split, including reclassifying an amount equal to the reduction in par value of common stock to additional paid-in capital. The primary reason for implementing the Reverse Stock Split was to regain compliance with the minimum bid price requirement of The NASDAQ Stock Market LLC (“Nasdaq”). On July 31, 2020, the Company was notified by Nasdaq that it had regained compliance with the Nasdaq listing requirements. In June 2016, the FASB issued Accounting Standards Update (“ASU”) 2016-13, “Financial Instruments-Credit Losses (Topic 326): Measurement of Credit Losses on Financial Instruments,” which require a financial asset (or a group of financial assets) measured at amortized cost basis to be presented at the net amount expected to be collected. The new standard was initially effective for fiscal years beginning after December 15, 2019, including interim periods within those fiscal years. In November 2019, the FASB issued ASU 2019-10 which deferred the effective date of ASU 2016-13 by three years for Smaller Reporting Companies. As a result, the effective date for the standard is fiscal years beginning after December 15, 2022, and interim periods therein, and early adoption is permitted. The Company is currently evaluating the impact of the adoption of ASU 2016-13 on its condensed consolidated financial statements. In December 2019, the FASB issued ASU 2019-12, “Simplifying the Accounting for Income Taxes,” which simplifies the accounting for income taxes related to the approach for intra-period tax allocation, the methodology for calculating income taxes in an interim period, and the recognition of deferred tax assets for investments. The guidance also r
Free historical financial statements for JAKKS Pacific Inc.. See how revenue, income, cash flow, and balance sheet financials have changed over 57 quarters since 2012. Compare with JAKK stock chart to see long term trends.
Data imported from JAKKS Pacific Inc. SEC filings. Check original filings before making any investment decision.