Industrials › Special Industry Machinery (No Metalworking Machinery)

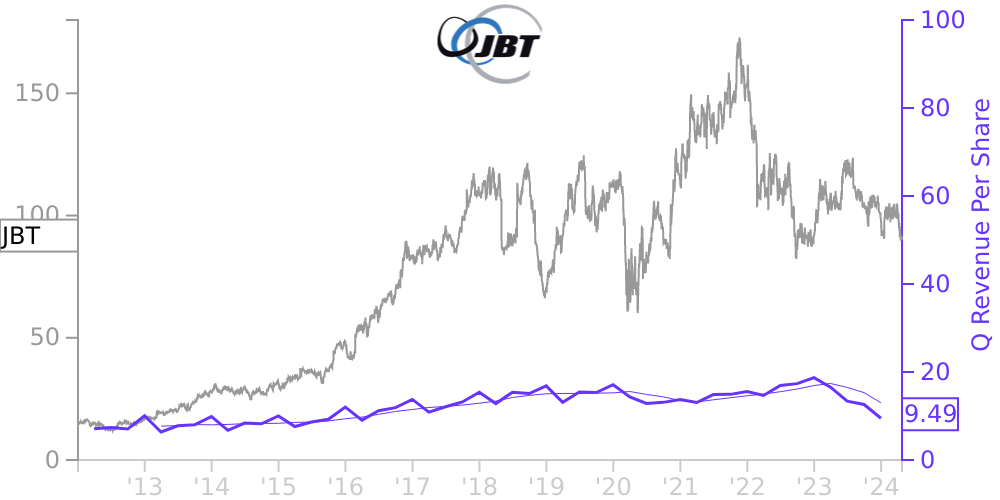
JBT Stock Price Correlated With John Bean Technologies Financials
External Links ⌄
Income Statement
Cash Flow
Balance Sheet
JBT Income Statement
Enable JavaScript and reload
Revenue, Net:
Cost of Goods & Services Sold:
Gross Profit:
Selling, General & Admin Expense:
Research & Development Expense:
Total Operating Expenses:
Operating Income:
Income Taxes:
Net Income:
JBT Cash Flow
Enable JavaScript and reload
Operating Activities Net Income:
Depreciation, Depletion & Amortization:
Change in Accounts Receiveable:
Net Cash from Operations:
Repurchases/Buybacks Common Stock:
Issuance of Long-term Debt:
Cash Dividends Paid:
Net Cash from Financing Activities:
Property, Plant & Equipment Purchases:
Purchases of Businesses, Net of Cash:
Net Cash from Investing Activities:
Net Change in Cash & Equivalents:
JBT Balance Sheet
Enable JavaScript and reload
Cash and Cash Equivalents:
Short-Term Investments:
Accounts Receivable, Net:
Inventories:
Total Current Assets:
Property, Plant & Equipment, Net:
Total Assets:
Accounts Payable:
Current Portion of Long-Term Debt:
Total Short-Term Liabilities:
Long Term Debt, Non-Current Portion:
Total Long-Term Liabilities:
Total Liabilities:
COMPANY PROFILE
DESCRIPTION OF BUSINESS AND BASIS OF PRESENTATION Description of Business
John Bean Technologies Corporation and its majority-owned consolidated subsidiaries (the “Company,” “JBT,” “our,” “us,” or “we”) provide global technology solutions to high-value segments of the food and beverage and air transportation industries. The Company designs, produces and services sophisticated products and systems for multi-national and regional customers through JBT FoodTech and JBT AeroTech segments. The Company has manufacturing operations worldwide that are strategically located to facilitate delivery of its products and services to its customers.
Basis of Presentation
In accordance with Securities and Exchange Commission (“SEC”) rules for interim periods, the accompanying unaudited condensed consolidated financial statements (the “interim financial statements”) do not include all of the information and notes for complete financial statements as required by accounting principles generally accepted in the United States of America (“U.S. GAAP”). As such, the accompanying interim financial statements should be read in conjunction with the Annual Report on Form 10-K for the year ended December 31, 2021, which provides a more complete description of the Company’s accounting policies, financial position, operating results, business, properties, and other matters. The year-end condensed consolidated Balance Sheet was derived from audited financial statements, but does not include all annual disclosures required by accounting principles generally accepted in the United States of America.
In the opinion of management, the interim financial statements reflect all normal recurring adjustments necessary for a fair statement of the Company's financial condition and operating results as of and for the periods presented. Revenue, expenses, assets and liabilities can vary during each quarter of the year. Therefore, the interim results and trends in the interim financial statements may not be representative of those for the full year or any future period.
Use of estimates
Preparation of financial statements that follow U.S. GAAP requires management to make estimates and judgments that affect the reported amounts of assets and liabilities and the disclosure of contingent assets and liabilities at the date of the financial statements, and the reported amounts of revenue and expenses during the reporting period. Actual results could differ from these estimates.
Recently Issued Accounting Standards Not Yet Adopted
In November 2021, the FASB issued ASU 2021-10, Government Assistance (Topic 832): Disclosures by Business Entities about Government Assistance. This update requires annual disclosures about transactions with a government that are accounted for by applying a grant or contribution accounting model by analogy. This standard is effective for annual periods beginning after December 15, 2021 and should be applied either prospectively or retrospectively. Early adoption is permitted. The Company is currently evaluating the impact of adopting ASU 2021-10 within its Form 10-K for the fiscal year 2022.
Free historical financial statements for John Bean Technologies Corp. See how revenue, income, cash flow, and balance sheet financials have changed over 52 quarters since 2012. Compare with JBT stock chart to see long term trends.
Data imported from John Bean Technologies Corp SEC filings. Check original filings before making any investment decision.