Technology › Computer Communications Equipment

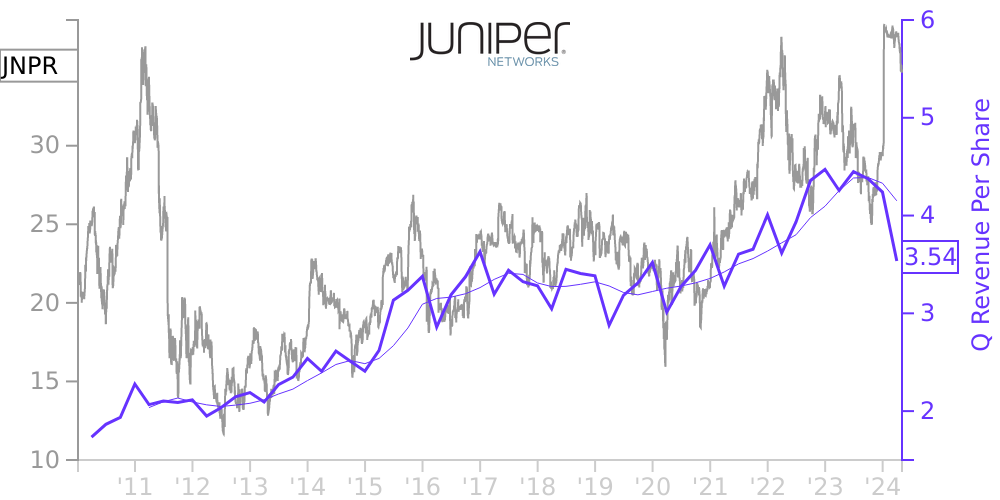
JNPR Stock Price Correlated With Juniper Networks Financials
External Links ⌄
Income Statement
Cash Flow
Balance Sheet
JNPR Income Statement
Enable JavaScript and reload
Revenue, Net:
Cost of Goods & Services Sold:
Gross Profit:
Selling, General & Admin Expense:
Research & Development Expense:
Total Operating Expenses:
Operating Income:
Income Taxes:
Net Income:
JNPR Cash Flow
Enable JavaScript and reload
Operating Activities Net Income:
Depreciation, Depletion & Amortization:
Change in Accounts Receiveable:
Net Cash from Operations:
Repurchases/Buybacks Common Stock:
Issuance of Long-term Debt:
Cash Dividends Paid:
Net Cash from Financing Activities:
Property, Plant & Equipment Purchases:
Purchases of Businesses, Net of Cash:
Net Cash from Investing Activities:
Net Change in Cash & Equivalents:
JNPR Balance Sheet
Enable JavaScript and reload
Cash and Cash Equivalents:
Short-Term Investments:
Accounts Receivable, Net:
Inventories:
Total Current Assets:
Property, Plant & Equipment, Net:
Total Assets:
Accounts Payable:
Current Portion of Long-Term Debt:
Total Short-Term Liabilities:
Long Term Debt, Non-Current Portion:
Total Long-Term Liabilities:
Total Liabilities:
COMPANY PROFILE
Basis of Presentation
Basis of Presentation
The unaudited Condensed Consolidated Financial Statements of Juniper Networks, Inc. (the “Company” or “Juniper”) have been prepared in accordance with U.S. generally accepted accounting principles (“U.S. GAAP”) for interim financial information. Accordingly, they do not include all of the information and footnotes required by U.S. GAAP for complete financial statements. The Condensed Consolidated Balance Sheet as of December 31, 2017 , has been derived from the audited Consolidated Financial Statements at that date. In the opinion of management, all adjustments, including normal recurring accruals, considered necessary for a fair presentation have been included. The results of operations for the three months ended March 31, 2018 , are not necessarily indicative of the results that may be expected for the year ending December 31, 2018 , or any future period.
The information included in this Quarterly Report on Form 10-Q (“Report”) should be read in conjunction with “Management's Discussion and Analysis of Financial Condition and Results of Operations,” “Risk Factors,” “Quantitative and Qualitative Disclosures About Market Risk,” and the Consolidated Financial Statements and footnotes thereto included in the Company's Annual Report on Form 10-K for the year ended December 31, 2017 (the "Form 10-K").
The Company adopted Financial Accounting Standards Board ("FASB") Accounting Standards Update ("ASU") No. 2016-18 (Topic 230) Statement of Cash Flow: Restricted Cash, effective January 1, 2018, using the retrospective transition method . Restricted cash of $47.4 million and $48.7 million in the prior period have been included with cash and cash equivalents when reconciling the beginning and ending total amounts, respectively, on the statement of cash flows for the three months ended March 31, 2017, to conform to the current period presentation. The adoption did not have a material impact on the cash flow activity presented on the Company's Condensed Consolidated Statement of Cash Flows for the three months ended March 31, 2017. See Note 3, Cash Equivalents and Investments for a reconciliation of the cash balances within our Condensed Consolidated Statements of Cash Flows to the Condensed Consolidated Balance Sheets.
The preparation of the financial statements and related disclosures in accordance with U.S. GAAP requires the Company to make judgments, assumptions, and estimates that affect the amounts reported in the Condensed Consolidated Financial Statements and the accompanying notes. Actual results could differ materially from those estimates under different assumptions or conditions.
Free historical financial statements for Juniper Networks Inc. See how revenue, income, cash flow, and balance sheet financials have changed over 61 quarters since 2010. Compare with JNPR stock chart to see long term trends.
Data imported from Juniper Networks Inc SEC filings. Check original filings before making any investment decision.