
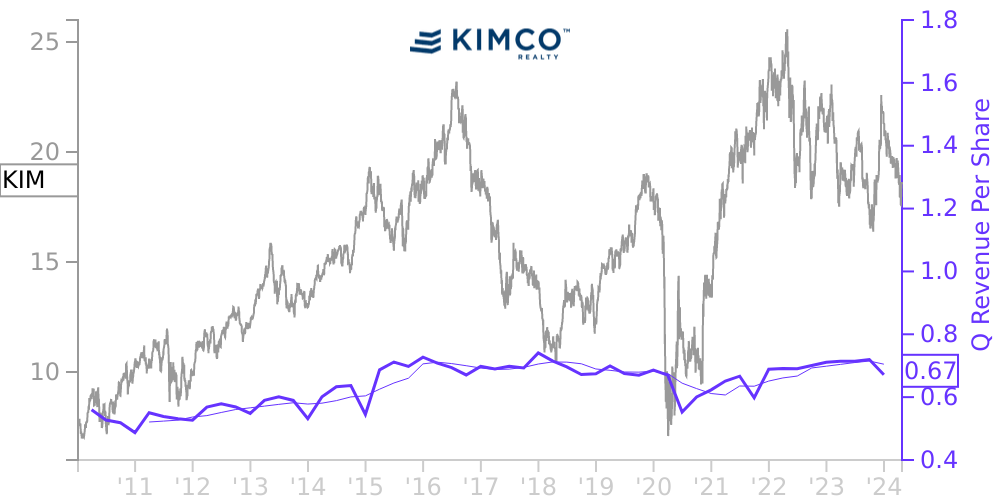
KIM Stock Price Correlated With Kimco Realty Financials
External Links ⌄
Income Statement
Cash Flow
Balance Sheet
KIM Income Statement
Enable JavaScript and reload
Revenue, Net:
Cost of Goods & Services Sold:
Gross Profit:
Selling, General & Admin Expense:
Research & Development Expense:
Total Operating Expenses:
Operating Income:
Income Taxes:
Net Income:
KIM Cash Flow
Enable JavaScript and reload
Operating Activities Net Income:
Depreciation, Depletion & Amortization:
Change in Accounts Receiveable:
Net Cash from Operations:
Repurchases/Buybacks Common Stock:
Issuance of Long-term Debt:
Cash Dividends Paid:
Net Cash from Financing Activities:
Property, Plant & Equipment Purchases:
Purchases of Businesses, Net of Cash:
Net Cash from Investing Activities:
Net Change in Cash & Equivalents:
KIM Balance Sheet
Enable JavaScript and reload
Cash and Cash Equivalents:
Short-Term Investments:
Accounts Receivable, Net:
Inventories:
Total Current Assets:
Property, Plant & Equipment, Net:
Total Assets:
Accounts Payable:
Current Portion of Long-Term Debt:
Total Short-Term Liabilities:
Long Term Debt, Non-Current Portion:
Total Long-Term Liabilities:
Total Liabilities:
COMPANY PROFILE
11. Variable Interest Entities ( “ VIE ”) :
Included within the Company’s operating properties at December 31, 2021 and 2020, are 34 and 22 consolidated entities, respectively, that are VIEs for which the Company is the primary beneficiary. In August 2021, the Company acquired 11 of these VIEs in conjunction with the Merger. These entities have been established to own and operate real estate property. The Company’s involvement with these entities is through its majority ownership and management of the properties. The entities were deemed VIEs primarily because the unrelated investors do not have substantive kick-out rights to remove the general or managing partner by a vote of a simple majority or less, and they do not have substantive participating rights. The Company determined that it was the primary beneficiary of these VIEs as a result of its controlling financial interest. At December 31, 2021, total assets of these VIEs were $1.6 billion and total liabilities were $153.9 million. At December 31, 2020, total assets of these VIEs were $1.0 billion and total liabilities were $62.1 million.
The majority of the operations of these VIEs are funded with cash flows generated from the properties. The Company has not provided financial support to any of these VIEs that it was not previously contractually required to provide, which consists primarily of funding any capital expenditures, including tenant improvements, which are deemed necessary to continue to operate the entity and any operating cash shortfalls that the entity may experience.
All liabilities of these VIEs are non-recourse to the Company (“VIE Liabilities”). The assets of the unencumbered VIEs are not restricted for use to settle only the obligations of these VIEs. The remaining VIE assets are encumbered by third -party non-recourse mortgage debt. The assets associated with these encumbered VIEs (“Restricted Assets”) are collateral under the respective mortgages and are therefore restricted and can only be used to settle the corresponding liabilities of the VIE. The classification of the Restricted Assets and VIE Liabilities on the Company’s Consolidated Balance Sheets are as follows (dollars in millions):
December 31, 2021 December 31, 2020
Number of unencumbered VIEs 30 19
Number of encumbered VIEs 4 3
Total number of consolidated VIEs 34 22
Restricted Assets:
Real estate, net $ 222.9 $ 97.7
Cash and cash equivalents 2.0 1.8
Accounts and notes receivable, net 2.0 1.9
Other assets 1.0 1.1
Total Restricted Assets $ 227.9 $ 102.5
VIE Liabilities:
Mortgages payable, net $ 78.9 $ 36.5
Accounts payable and accrued expenses 11.8 5.2
Operating lease liabilities 6.7 5.5
Other liabilities 56.5 14.9
Total VIE Liabilities $ 153.9 $ 62.1
Free historical financial statements for Kimco Realty Corp.. See how revenue, income, cash flow, and balance sheet financials have changed over 65 quarters since 2010. Compare with KIM stock chart to see long term trends.
Data imported from Kimco Realty Corp. SEC filings. Check original filings before making any investment decision.