Energy › Natural Gas Transmission

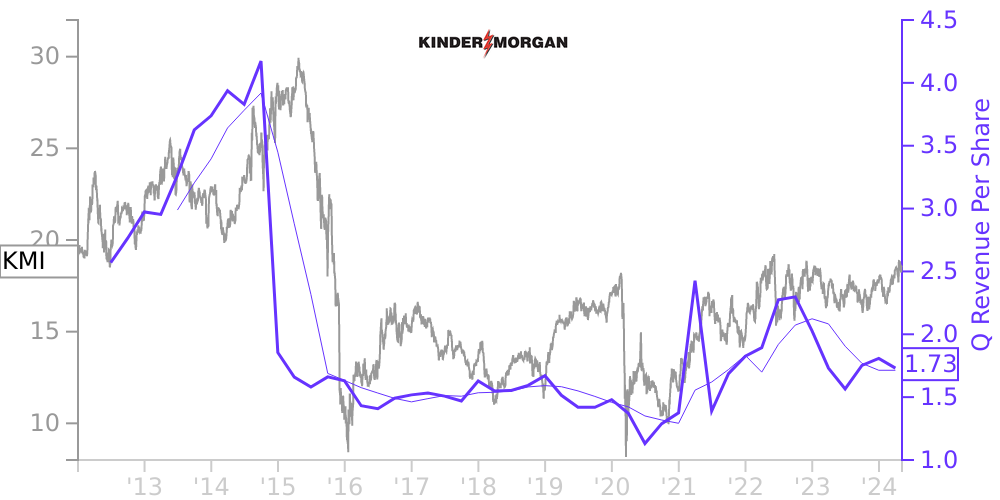
KMI Stock Price Correlated With Kinder Morgan Financials
External Links ⌄
Income Statement
Cash Flow
Balance Sheet
KMI Income Statement
Enable JavaScript and reload
Revenue, Net:
Cost of Goods & Services Sold:
Gross Profit:
Selling, General & Admin Expense:
Research & Development Expense:
Total Operating Expenses:
Operating Income:
Income Taxes:
Net Income:
KMI Cash Flow
Enable JavaScript and reload
Operating Activities Net Income:
Depreciation, Depletion & Amortization:
Change in Accounts Receiveable:
Net Cash from Operations:
Repurchases/Buybacks Common Stock:
Issuance of Long-term Debt:
Cash Dividends Paid:
Net Cash from Financing Activities:
Property, Plant & Equipment Purchases:
Purchases of Businesses, Net of Cash:
Net Cash from Investing Activities:
Net Change in Cash & Equivalents:
KMI Balance Sheet
Enable JavaScript and reload
Cash and Cash Equivalents:
Short-Term Investments:
Accounts Receivable, Net:
Inventories:
Total Current Assets:
Property, Plant & Equipment, Net:
Total Assets:
Accounts Payable:
Current Portion of Long-Term Debt:
Total Short-Term Liabilities:
Long Term Debt, Non-Current Portion:
Total Long-Term Liabilities:
Total Liabilities:
COMPANY PROFILE
1. General
We are one of the largest energy infrastructure companies in North America and unless the context requires otherwise, references to “we,” “us,” “our,” “the Company,” or “KMI” are intended to mean Kinder Morgan, Inc. and its consolidated subsidiaries. Our pipelines transport natural gas, refined petroleum products, crude oil, condensate, CO 2 and other products, and our terminals store and handle various commodities including gasoline, diesel fuel, chemicals, metals and petroleum coke.
We are one of the largest energy infrastructure companies in North America and unless the context requires otherwise, references to “we,” “us,” “our,” “the Company,” or “KMI” are intended to mean Kinder Morgan, Inc. and its consolidated subsidiaries. Our pipelines transport natural gas, refined petroleum products, crude oil, condensate, CO 2 and other products, and our terminals store and handle various commodities including gasoline, diesel fuel, chemicals, metals and petroleum coke.
Free historical financial statements for Kinder Morgan Inc. See how revenue, income, cash flow, and balance sheet financials have changed over 56 quarters since 2012. Compare with KMI stock chart to see long term trends.
Data imported from Kinder Morgan Inc SEC filings. Check original filings before making any investment decision.