Industrials › Trucking (No Local)
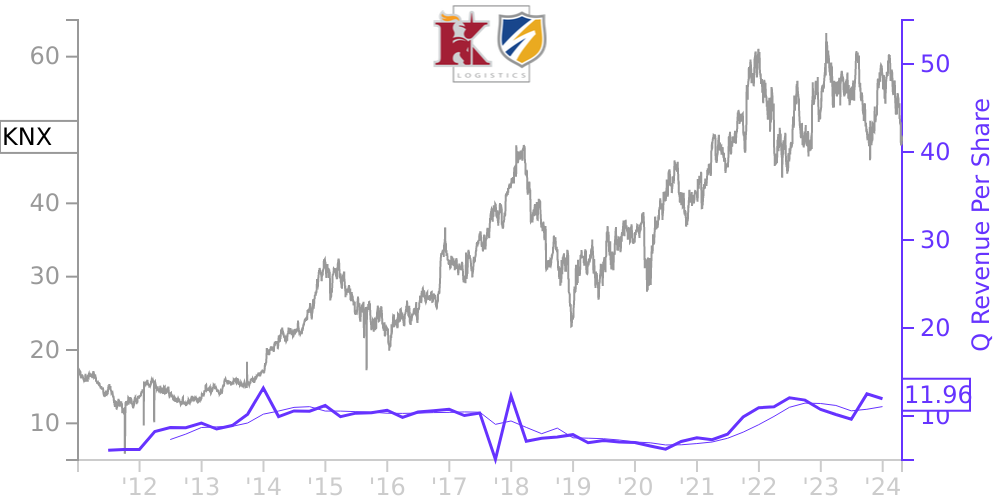
KNX Stock Price Correlated With Knight-Swift Transportation Holdings Financials
External Links ⌄
Income Statement
Cash Flow
Balance Sheet
KNX Income Statement
Enable JavaScript and reload
Revenue, Net:
Cost of Goods & Services Sold:
Gross Profit:
Selling, General & Admin Expense:
Research & Development Expense:
Total Operating Expenses:
Operating Income:
Income Taxes:
Net Income:
KNX Cash Flow
Enable JavaScript and reload
Operating Activities Net Income:
Depreciation, Depletion & Amortization:
Change in Accounts Receiveable:
Net Cash from Operations:
Repurchases/Buybacks Common Stock:
Issuance of Long-term Debt:
Cash Dividends Paid:
Net Cash from Financing Activities:
Property, Plant & Equipment Purchases:
Purchases of Businesses, Net of Cash:
Net Cash from Investing Activities:
Net Change in Cash & Equivalents:
KNX Balance Sheet
Enable JavaScript and reload
Cash and Cash Equivalents:
Short-Term Investments:
Accounts Receivable, Net:
Inventories:
Total Current Assets:
Property, Plant & Equipment, Net:
Total Assets:
Accounts Payable:
Current Portion of Long-Term Debt:
Total Short-Term Liabilities:
Long Term Debt, Non-Current Portion:
Total Long-Term Liabilities:
Total Liabilities:
COMPANY PROFILE
Introduction and Basis of Presentation Certain acronyms and terms used throughout this Annual Report are specific to Knight-Swift, commonly used in the trucking industry, or are otherwise frequently used throughout this document. Definitions for these acronyms and terms are provided in the "Glossary of Terms," available in the front of this document.
Description of Business
Knight-Swift is a transportation solutions provider, headquartered in Phoenix, Arizona. During 2021, the Truckload segment operated an average of 18,019 tractors (comprised of 16,166 company tractors and 1,853 independent contractor tractors). The Company operated 67,606 trailers during the year, including trailers within the Truckload segment and leasing activities within the non-reportable segments. The LTL segment operated an average 2,735 tractors and 7,413 trailers. Additionally, the Intermodal segment operated an average of 597 tractors and 10,847 intermo dal cont ainers. The Company's four reportable segments are Truckload, Logistics, LTL, and Intermodal.
2017 Merger
On September 8, 2017, the Company became Knight-Swift Transportation Holdings Inc. upon the effectiveness of the 2017 Merger. Immediately upon the consummation of the 2017 Merger, former Knight stockholders and former Swift stockholders owned approximately 46.0% and 54.0%, respectively, of the Company. Upon closing of the 2017 Merger, the shares of Knight common stock that previously traded under the ticker symbol "KNX" ceased trading and were delisted from the NYSE. The shares of Class A common stock commenced trading on the NYSE on a post-reverse split basis under the ticker symbol "KNX" on September 11, 2017.
Recent Acquisitions
The Company recently acquired the following entities:
• 100.0% of MME on December 6, 2021. The results are included within the LTL segment.
• 100.0% of ACT on July 5, 2021. The results are included within the LTL segment.
• 100.0% of UTXL on June 1, 2021. The results are included within the Logistics segment.
• 79.44% of Eleos on February 1, 2021. The results are included within the non-reportable segments. The noncontrolling interest is presented as a separate component of the consolidated financial statements.
• 100.0% of Warehousing Co. on January 1, 2020. The results are included within the non-reportable segments.
Note regarding comparability: In accordance with the accounting treatment applicable to the transactions, the Company's consolidated results, as reported, do not include the operating results of its ownership interest in the acquired entities prior to the respective acquisition dates. Accordingly, comparisons between the Company's current and prior period results may not be meaningful.
Additional information regarding the Company's recent acquisitions is included in Note 4 .
Basis of Presentation
The consolidated financial statements include the accounts of Knight-Swift Transportation Holdings Inc. and its subsidiaries. In management's opinion, these consolidated financial statements were prepared in accordance with GAAP and include all adjustments necessary (consisting of normal recurring adjustments) for the fair presentation of the periods presented.
With respect to transactional/durational data, references to "years", including "2021", "2020", and "2019" pertain to calendar years. Similarly, references to "quarters", including "first", "second", "third", and "fourth" pertain to calendar quarters.
Seasonality
In the full truckload transportation industry, results of operations generally follow a seasonal pattern. Freight volumes in the first quarter are typically lower due to less consumer demand, customers reducing shipments following the holiday season, and inclement weather. At the same time, operating expenses generally increase, and tractor productivity of the Company's Truckload fleet, independent contractors, and third-party carriers decreases during the winter months due to decreased fuel efficiency, increased
Free historical financial statements for Knight-Swift Transportation Holdings Inc.. See how revenue, income, cash flow, and balance sheet financials have changed over 60 quarters since 2011. Compare with KNX stock chart to see long term trends.
Data imported from Knight-Swift Transportation Holdings Inc. SEC filings. Check original filings before making any investment decision.