Consumer Discretionary › Motor Vehicle Parts And Accessories

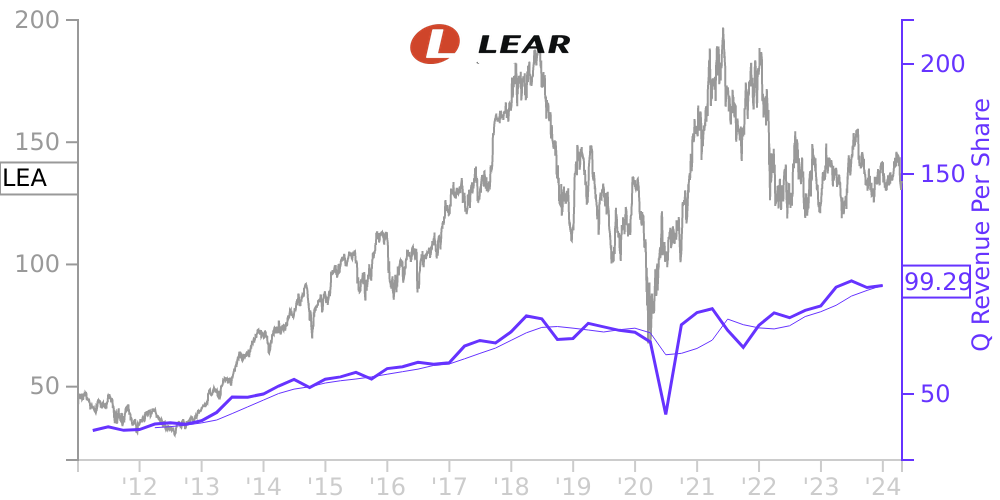
LEA Stock Price Correlated With Lear Financials
External Links ⌄
Income Statement
Cash Flow
Balance Sheet
LEA Income Statement
Enable JavaScript and reload
Revenue, Net:
Cost of Goods & Services Sold:
Gross Profit:
Selling, General & Admin Expense:
Research & Development Expense:
Total Operating Expenses:
Operating Income:
Income Taxes:
Net Income:
LEA Cash Flow
Enable JavaScript and reload
Operating Activities Net Income:
Depreciation, Depletion & Amortization:
Change in Accounts Receiveable:
Net Cash from Operations:
Repurchases/Buybacks Common Stock:
Issuance of Long-term Debt:
Cash Dividends Paid:
Net Cash from Financing Activities:
Property, Plant & Equipment Purchases:
Purchases of Businesses, Net of Cash:
Net Cash from Investing Activities:
Net Change in Cash & Equivalents:
LEA Balance Sheet
Enable JavaScript and reload
Cash and Cash Equivalents:
Short-Term Investments:
Accounts Receivable, Net:
Inventories:
Total Current Assets:
Property, Plant & Equipment, Net:
Total Assets:
Accounts Payable:
Current Portion of Long-Term Debt:
Total Short-Term Liabilities:
Long Term Debt, Non-Current Portion:
Total Long-Term Liabilities:
Total Liabilities:
COMPANY PROFILE
Basis of Presentation Lear Corporation ("Lear," and together with its consolidated subsidiaries, the "Company") and its affiliates design and manufacture automotive seating and electrical distribution systems and related components. The Company's main customers are automotive original equipment manufacturers. The Company operates facilities worldwide.
The accompanying consolidated financial statements include the accounts of Lear, a Delaware corporation, and the wholly owned and less than wholly owned subsidiaries controlled by Lear.
The accompanying consolidated financial statements include the accounts of Lear, a Delaware corporation, and the wholly owned and less than wholly owned subsidiaries controlled by Lear.
Free historical financial statements for Lear Corp. See how revenue, income, cash flow, and balance sheet financials have changed over 61 quarters since 2011. Compare with LEA stock chart to see long term trends.
Data imported from Lear Corp SEC filings. Check original filings before making any investment decision.