Consumer Discretionary › Gen Building Contractors - Residential Buildings

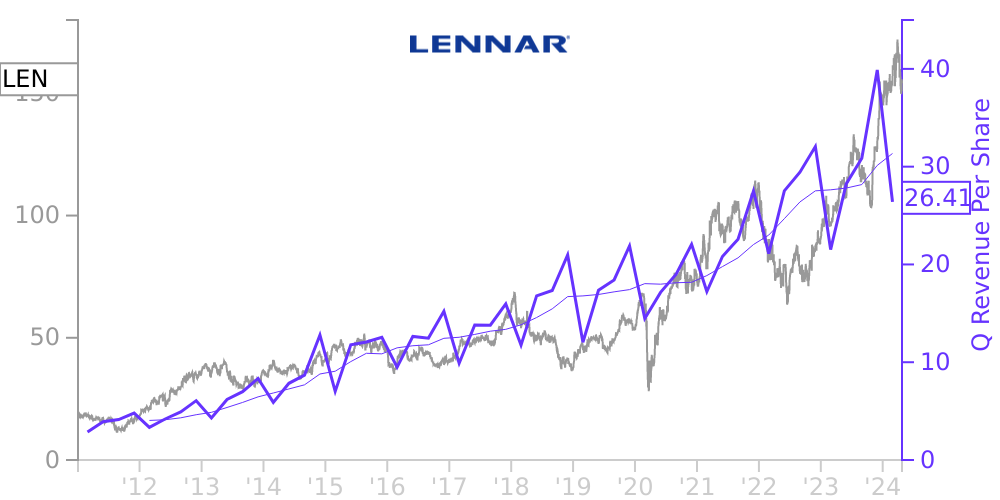
LEN Stock Price Correlated With Lennar Financials
External Links ⌄
Income Statement
Cash Flow
Balance Sheet
LEN Income Statement
Enable JavaScript and reload
Revenue, Net:
Cost of Goods & Services Sold:
Gross Profit:
Selling, General & Admin Expense:
Research & Development Expense:
Total Operating Expenses:
Operating Income:
Income Taxes:
Net Income:
LEN Cash Flow
Enable JavaScript and reload
Operating Activities Net Income:
Depreciation, Depletion & Amortization:
Change in Accounts Receiveable:
Net Cash from Operations:
Repurchases/Buybacks Common Stock:
Issuance of Long-term Debt:
Cash Dividends Paid:
Net Cash from Financing Activities:
Property, Plant & Equipment Purchases:
Purchases of Businesses, Net of Cash:
Net Cash from Investing Activities:
Net Change in Cash & Equivalents:
LEN Balance Sheet
Enable JavaScript and reload
Cash and Cash Equivalents:
Short-Term Investments:
Accounts Receivable, Net:
Inventories:
Total Current Assets:
Property, Plant & Equipment, Net:
Total Assets:
Accounts Payable:
Current Portion of Long-Term Debt:
Total Short-Term Liabilities:
Long Term Debt, Non-Current Portion:
Total Long-Term Liabilities:
Total Liabilities:
COMPANY PROFILE
Basis of Presentation Basis of Consolidation
The condensed consolidated financial statements have been prepared in accordance with accounting principles generally accepted in the United States of America ("GAAP") for interim financial information and pursuant to the rules and regulations of the Securities and Exchange Commission. Accordingly, they do not include all of the information and footnotes required by GAAP for complete financial statements. These condensed consolidated financial statements should be read in conjunction with the consolidated financial statements in the Company’s Annual Report on Form 10-K for the year ended November 30, 2021. The basis of consolidation is unchanged from the disclosure in the Company's Notes to Consolidated Financial Statements section in its Form 10-K for the year ended November 30, 2021. In the opinion of management, all adjustments (consisting of normal recurring adjustments) necessary for the fair presentation of the accompanying condensed consolidated financial statements have been made.
The Company has historically experienced, and expects to continue to experience, variability in quarterly results. The condensed consolidated statements of operations for both the three and six months ended May 31, 2022 are not necessarily indicative of the results to be expected for the full year.
Use of Estimates
The preparation of financial statements in conformity with GAAP requires management to make estimates and assumptions that affect the amounts reported in the condensed consolidated financial statements and accompanying notes. Actual results could differ from those estimates.
Cash and Cash Equivalents
Homebuilding cash and cash equivalents as of May 31, 2022 and November 30, 2021 included $859.8 million and $940.4 million, respectively, of cash held in escrow. On average for the three months ended May 31, 2022, cash was held in escrow for approximately two days.
Homebuilding Revenue Recognition
Homebuilding revenues and related profits from sales of homes are recognized at the time of the closing of a sale, when title to and possession of the property are transferred to the homebuyer. In order to promote sales of the homes, the Company may offer sales incentives to homebuyers. The types of incentives vary on a community-by-community basis and home-by-home basis. They include primarily price discounts on individual homes and financing incentives, all of which are reflected as a reduction of home sales revenues. For the three months ended May 31, 2022 and 2021, sales incentives offered to homebuyers averaged $7,200 per home, or 1.5% as a percentage of home sales revenues, and $9,000 per home, or 2.1% as a percentage of home sales revenues, respectively. For the six months ended May 31, 2022 and 2021, sales incentives offered to homebuyers averaged $7,800 per home, or 1.6% as a percentage of home sales revenues, and $10,500 per home, or 2.5% as a percentage of home sales revenues, respectively.
Share-based Payments
During both the three months ended May 31, 2022 and 2021, the Company granted employees an immaterial number of nonvested shares. During both the six months ended May 31, 2022 and 2021, the Company granted employees 1.4 million nonvested shares, respectively.
Recently Adopted Accounting Pronouncements
In December 2019, the FASB issued ASU 2019-12, Income Taxes (Topic 740), Simplifying the Accounting for Income Taxes ("ASU 2019-12"). ASU 2019-12 was effective for the Company’s fiscal year beginning December 1, 2021. The adoption of ASU 2019-12 did not have a material impact on the Company's condensed consolidated financial statements.
Free historical financial statements for Lennar Corp. See how revenue, income, cash flow, and balance sheet financials have changed over 62 quarters since 2011. Compare with LEN stock chart to see long term trends.
Data imported from Lennar Corp SEC filings. Check original filings before making any investment decision.