Consumer Discretionary › Operative Builders

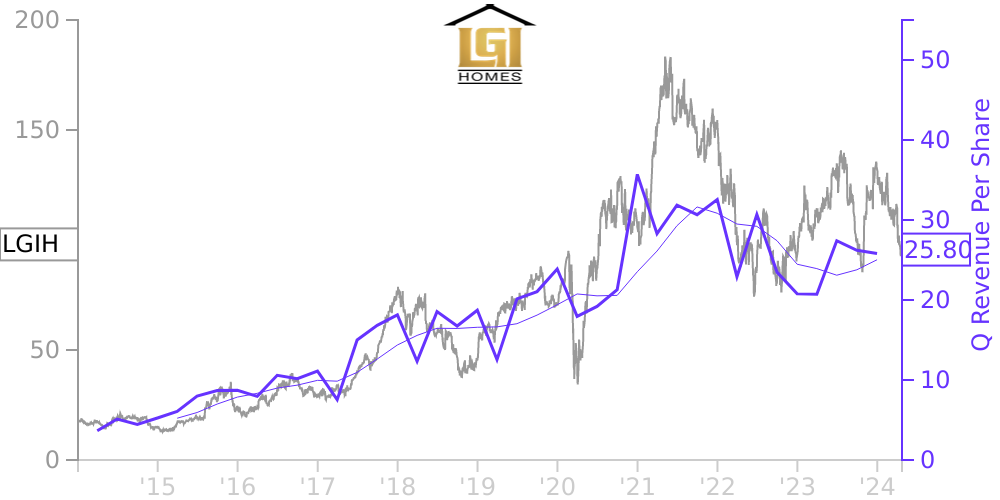
LGIH Stock Price Correlated With LGI Homes Financials
External Links ⌄
Income Statement
Cash Flow
Balance Sheet
LGIH Income Statement
Enable JavaScript and reload
Revenue, Net:
Cost of Goods & Services Sold:
Gross Profit:
Selling, General & Admin Expense:
Research & Development Expense:
Total Operating Expenses:
Operating Income:
Income Taxes:
Net Income:
LGIH Cash Flow
Enable JavaScript and reload
Operating Activities Net Income:
Depreciation, Depletion & Amortization:
Change in Accounts Receiveable:
Net Cash from Operations:
Repurchases/Buybacks Common Stock:
Issuance of Long-term Debt:
Cash Dividends Paid:
Net Cash from Financing Activities:
Property, Plant & Equipment Purchases:
Purchases of Businesses, Net of Cash:
Net Cash from Investing Activities:
Net Change in Cash & Equivalents:
LGIH Balance Sheet
Enable JavaScript and reload
Cash and Cash Equivalents:
Short-Term Investments:
Accounts Receivable, Net:
Inventories:
Total Current Assets:
Property, Plant & Equipment, Net:
Total Assets:
Accounts Payable:
Current Portion of Long-Term Debt:
Total Short-Term Liabilities:
Long Term Debt, Non-Current Portion:
Total Long-Term Liabilities:
Total Liabilities:
COMPANY PROFILE
ORGANIZATION AND BUSINESS Organization and Description of the Business
LGI Homes, Inc., a Delaware corporation (the “Company”, “we,” “us,” or “our”), is headquartered in The Woodlands, Texas. We engage in the development of communities and the design, construction and sale of new homes in markets in Texas, Arizona, Florida, Georgia, New Mexico, Colorado, North Carolina, South Carolina, Washington, Tennessee, Minnesota, Oklahoma, Alabama, California, Oregon, Nevada, West Virginia, Virginia and Pennsylvania.
Acquisitions
On May 6, 2021, we acquired certain real estate assets owned by KenRoe Inc. and its affiliated entities, including R Home LLC and Paxmar Land Development (collectively, “KenRoe”), and assumed certain related liabilities. As a result of the KenRoe acquisition, we expanded our Minnesota presence in the Minneapolis market. We acquired approximately 100 homes under construction and more than 3,000 owned and controlled lots. The total purchase price for the KenRoe assets, primarily consisting of inventory, was approximately $27.3 million in cash, subject to certain potential post-closing adjustments. The acquisition is accounted for in accordance with Accounting Standards Codification (“ASC”) Topic 805, Business Combinations (“ASC 805”). Our purchase accounting for KenRoe as of December 31, 2021 is preliminary and we expect to complete the working capital adjustment and valuation of the tangible assets, intangible assets and liabilities assumed as of the acquisition date within one year from the acquisition date.
On July 14, 2021, we acquired the real estate assets of Buffington Homebuilding Group, Ltd. (“Buffington”) and assumed certain related liabilities. The total purchase price for the Buffington assets, primarily consisting of inventory, was approximately $39.1 million in cash, subject to certain potential post-closing adjustments. This acquisition further expands our land position in the Austin, Texas market. The acquired assets include over 100 homes under construction, and more than 500 owned and controlled lots. The acquisition is accounted for in accordance with ASC 805. Our purchase accounting for Buffington as of December 31, 2021 is preliminary and we expect to complete the working capital adjustment and valuation of the tangible assets, intangible assets and liabilities assumed as of the acquisition date within one year from the acquisition date.
Free historical financial statements for LGI Homes Inc.. See how revenue, income, cash flow, and balance sheet financials have changed over 49 quarters since 2014. Compare with LGIH stock chart to see long term trends.
Data imported from LGI Homes Inc. SEC filings. Check original filings before making any investment decision.