Industrials › Air Cond And Warm Air Heating Equip And Comm And Indl Refrig Equip

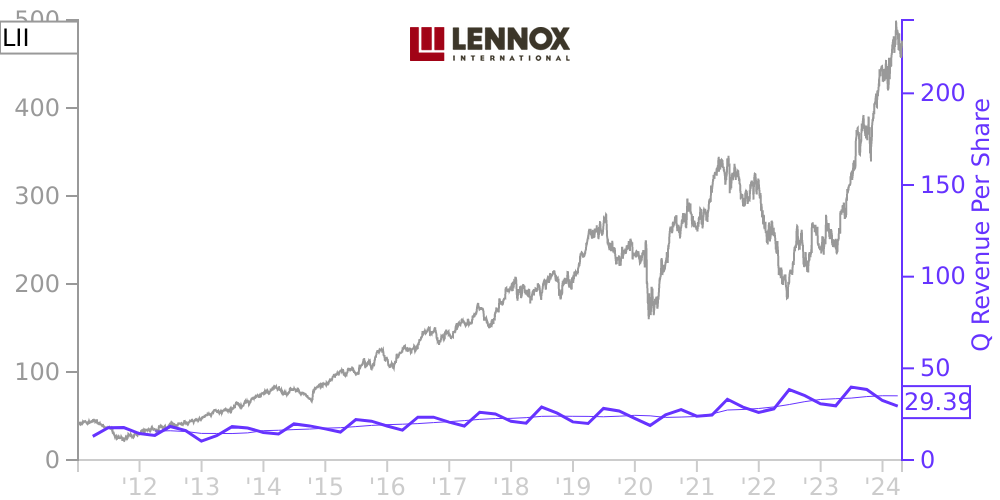
LII Stock Price Correlated With Lennox International Financials
External Links ⌄
Income Statement
Cash Flow
Balance Sheet
LII Income Statement
Enable JavaScript and reload
Revenue, Net:
Cost of Goods & Services Sold:
Gross Profit:
Selling, General & Admin Expense:
Research & Development Expense:
Total Operating Expenses:
Operating Income:
Income Taxes:
Net Income:
LII Cash Flow
Enable JavaScript and reload
Operating Activities Net Income:
Depreciation, Depletion & Amortization:
Change in Accounts Receiveable:
Net Cash from Operations:
Repurchases/Buybacks Common Stock:
Issuance of Long-term Debt:
Cash Dividends Paid:
Net Cash from Financing Activities:
Property, Plant & Equipment Purchases:
Purchases of Businesses, Net of Cash:
Net Cash from Investing Activities:
Net Change in Cash & Equivalents:
LII Balance Sheet
Enable JavaScript and reload
Cash and Cash Equivalents:
Short-Term Investments:
Accounts Receivable, Net:
Inventories:
Total Current Assets:
Property, Plant & Equipment, Net:
Total Assets:
Accounts Payable:
Current Portion of Long-Term Debt:
Total Short-Term Liabilities:
Long Term Debt, Non-Current Portion:
Total Long-Term Liabilities:
Total Liabilities:
COMPANY PROFILE
References in this Quarterly Report on Form 10-Q to "we," "our," "us," "LII," or the "Company" refer to Lennox International Inc. and its subsidiaries, unless the context requires otherwise.
Basis of Presentation
The accompanying unaudited Consolidated Balance Sheet as of June 30, 2022, the accompanying unaudited Consolidated Statements of Operations for the three and six months ended June 30, 2022 and 2021, the accompanying unaudited Consolidated Statements of Comprehensive Income for the three and six months ended June 30, 2022 and 2021, the accompanying unaudited Consolidated Statements of Stockholders' Deficit for the three and six months ended June 30, 2022 and 2021, and the accompanying unaudited Consolidated Statements of Cash Flows for the six months ended June 30, 2022 and 2021 should be read in conjunction with our audited consolidated financial statements and footnotes included in our Annual Report on Form 10-K for the year ended December 31, 2021.
The accompanying unaudited consolidated financial statements have been prepared in accordance with generally accepted accounting principles (“GAAP”) for interim financial information and with the instructions to Form 10-Q and Article 10 of Regulation S-X. The accompanying consolidated financial statements contain all material adjustments, consisting principally of normal recurring adjustments, necessary for a fair presentation of our financial position, results of operations and cash flows. Certain information and footnote disclosures normally included in financial statements prepared in accordance with GAAP have been condensed or omitted pursuant to applicable rules and regulations, although we believe that the disclosures herein are adequate to make the information presented not misleading. The operating results for the interim periods are not necessarily indicative of the results that may be expected for a full year.
Our fiscal quarterly periods are comprised of approximately 13 weeks, but the number of days per quarter may vary year-over-year. Our quarterly reporting periods usually end on the Saturday closest to the last day of March, June and September. Our fourth quarter and fiscal year ends on December 31, regardless of the day of the week on which December 31 falls. For convenience, the 13-week periods comprising each fiscal quarter are denoted by the last day of the respective calendar quarter.
Use of Estimates
The preparation of financial statements requires us to make estimates and assumptions about future events. These estimates and the underlying assumptions affect the amounts of assets and liabilities reported, disclosures about contingent assets and liabilities, and reported amounts of revenues and expenses. Such estimates include the valuation of accounts receivable, inventories, goodwill, intangible assets and other long-lived assets, contingencies, guarantee obligations, indemnifications, and assumptions used in the calculation of income taxes, pension and post-retirement medical benefits, self-insurance and warranty reserves, and stock-based compensation, among others. These estimates and assumptions are based on our best estimates and judgment.
We evaluate these estimates and assumptions on an ongoing basis using historical experience and other factors, including the current economic environment. We believe these estimates and assumptions to be reasonable under the circumstances and will adjust such estimates and assumptions when facts and circumstances dictate. Volatile equity, foreign currency and commodity markets combine to increase the uncertainty inherent in such estimates and assumptions. Future events and their effects cannot be determined with precision and actual results could differ significantly from these estimates. Changes in these estimates will be reflected in the financial statements in future periods.
Impact of COVID-19 Pandemic
A novel strain of coronavirus (“COVID-19”) has surfaced and spread around the world. The COVID-1
Free historical financial statements for Lennox International Inc. See how revenue, income, cash flow, and balance sheet financials have changed over 61 quarters since 2011. Compare with LII stock chart to see long term trends.
Data imported from Lennox International Inc SEC filings. Check original filings before making any investment decision.