Industrials › Farm Machinery And Equipment

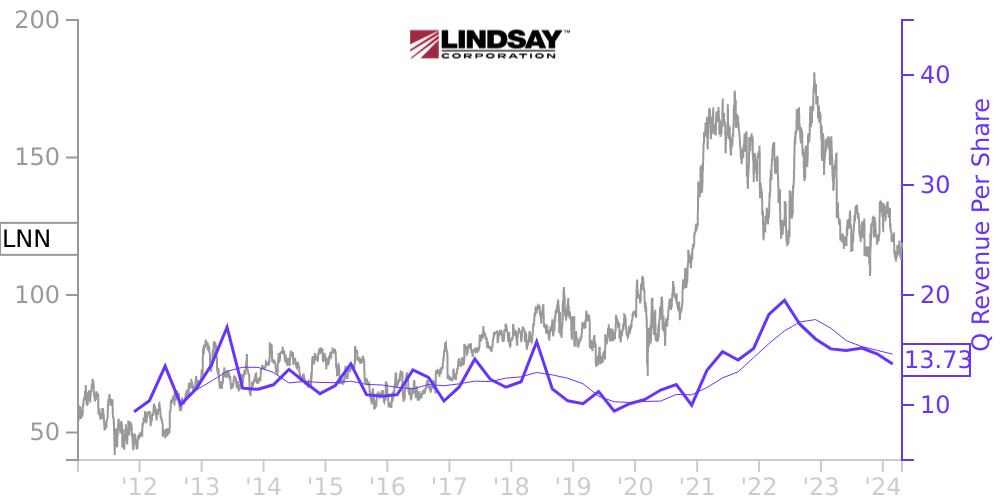
LNN Stock Price Correlated With Lindsay Financials
External Links ⌄
Income Statement
Cash Flow
Balance Sheet
LNN Income Statement
Enable JavaScript and reload
Revenue, Net:
Cost of Goods & Services Sold:
Gross Profit:
Selling, General & Admin Expense:
Research & Development Expense:
Total Operating Expenses:
Operating Income:
Income Taxes:
Net Income:
LNN Cash Flow
Enable JavaScript and reload
Operating Activities Net Income:
Depreciation, Depletion & Amortization:
Change in Accounts Receiveable:
Net Cash from Operations:
Repurchases/Buybacks Common Stock:
Issuance of Long-term Debt:
Cash Dividends Paid:
Net Cash from Financing Activities:
Property, Plant & Equipment Purchases:
Purchases of Businesses, Net of Cash:
Net Cash from Investing Activities:
Net Change in Cash & Equivalents:
LNN Balance Sheet
Enable JavaScript and reload
Cash and Cash Equivalents:
Short-Term Investments:
Accounts Receivable, Net:
Inventories:
Total Current Assets:
Property, Plant & Equipment, Net:
Total Assets:
Accounts Payable:
Current Portion of Long-Term Debt:
Total Short-Term Liabilities:
Long Term Debt, Non-Current Portion:
Total Long-Term Liabilities:
Total Liabilities:
COMPANY PROFILE
Note 1 – Condensed Consolidated Financial Statements
The condensed consolidated financial statements are presented in accordance with the rules and regulations of the Securities and Exchange Commission (SEC) and do not include all of the disclosures normally required by U.S. generally accepted accounting principles as contained in Lindsay Corporation’s (the “Company”) Annual Report on Form 10-K . Accordingly, these condensed consolidated financial statements should be read in conjunction with the consolidated financial statements and notes thereto included in the Company’s most recent Annual Report on Form 10-K for the fiscal year ended August 31, 201 2 .
In the opinion of management, the condensed consolidated financial statements of the Company reflect all adjustments (consisting of only normal recurring accruals) necessary to present fair ly the financial position and the results of operations and cash flows for the periods presented . The results for interim periods are not necessarily indicative of trends or results expected by the Company for a full year.
The condensed consolidated financial statements were prepared using accounting principles generally accepted in the United States. These principles require us to make estimates and assumptions that affect the reported amounts of assets and liabilities, the disclosure of contingent assets and liabilities and the reported amounts of revenues and expenses. Actual results could differ from these estimates. Certain reclassifications have been made to prior financial statements and notes to conform to the current year presentation. These reclassifications were not material to the Company’s condensed consolidated financial statements.
Free historical financial statements for Lindsay Corp. See how revenue, income, cash flow, and balance sheet financials have changed over 59 quarters since 2011. Compare with LNN stock chart to see long term trends.
Data imported from Lindsay Corp SEC filings. Check original filings before making any investment decision.