Consumer Discretionary › Services-Computer Integrated Systems Design

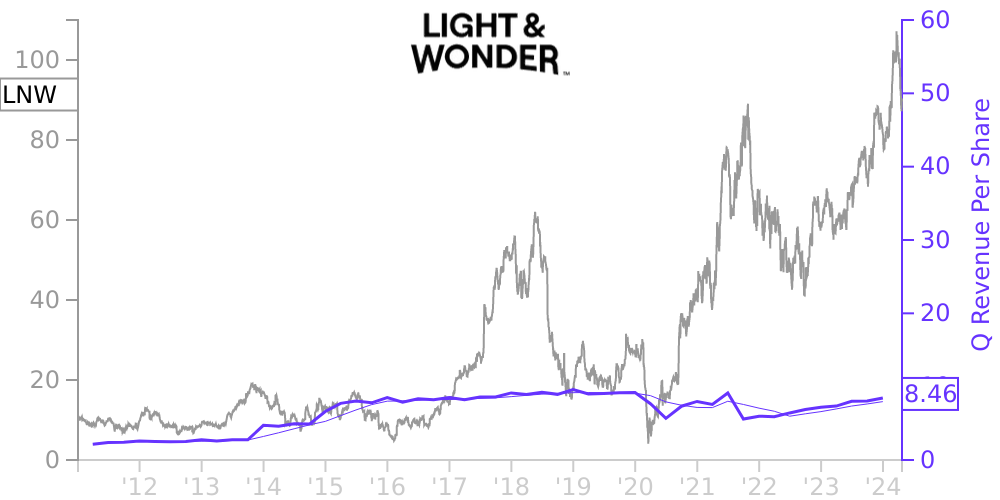
LNW Stock Price Correlated With Light & Wonder Financials
External Links ⌄
Income Statement
Cash Flow
Balance Sheet
LNW Income Statement
Enable JavaScript and reload
Revenue, Net:
Cost of Goods & Services Sold:
Gross Profit:
Selling, General & Admin Expense:
Research & Development Expense:
Total Operating Expenses:
Operating Income:
Income Taxes:
Net Income:
LNW Cash Flow
Enable JavaScript and reload
Operating Activities Net Income:
Depreciation, Depletion & Amortization:
Change in Accounts Receiveable:
Net Cash from Operations:
Repurchases/Buybacks Common Stock:
Issuance of Long-term Debt:
Cash Dividends Paid:
Net Cash from Financing Activities:
Property, Plant & Equipment Purchases:
Purchases of Businesses, Net of Cash:
Net Cash from Investing Activities:
Net Change in Cash & Equivalents:
LNW Balance Sheet
Enable JavaScript and reload
Cash and Cash Equivalents:
Short-Term Investments:
Accounts Receivable, Net:
Inventories:
Total Current Assets:
Property, Plant & Equipment, Net:
Total Assets:
Accounts Payable:
Current Portion of Long-Term Debt:
Total Short-Term Liabilities:
Long Term Debt, Non-Current Portion:
Total Long-Term Liabilities:
Total Liabilities:
COMPANY PROFILE
(1) Consolidated Financial Statements
Basis of Presentation
The Consolidated Balance Sheet as of March 31, 2011, the Consolidated Statements of Operations for the three months ended March 31, 2011 and 2010, and the Consolidated Statements of Cash Flows for the three months ended March 31, 2011 and 2010, have been prepared by Scientific Games Corporation and are unaudited. When used in these notes, the terms we, us, our and the Company refer to Scientific Games Corporation and all entities included in our consolidated financial statements unless otherwise specified or the context otherwise indicates. In the opinion of management, all adjustments necessary to present fairly our consolidated financial position as of March 31, 2011 and the results of our operations and our cash flows for the three months ended March 31, 2011 and 2010 have been made. Such adjustments are of a normal, recurring nature.
Certain information and footnote disclosures normally included in consolidated financial statements prepared in accordance with accounting principles generally accepted in the United States of America have been condensed or omitted. These consolidated financial statements should be read in conjunction with the consolidated financial statements and notes thereto included in our 2010 Annual Report on Form 10-K. The results of operations for the period ended March 31, 2011 are not necessarily indicative of the operating results for the full year.
Significant Accounting Policies
We describe our significant accounting policies in Note 1 of the Notes to Consolidated Financial Statements in our 2010 Annual Report on Form 10-K. There have been no changes to our significant accounting policies during the period ended March 31, 2011 except as discussed below.
In September 2009, the Financial Accounting Standards Board (FASB) amended the Accounting Standards Codification (ASC) as summarized in Accounting Standards Update (ASU) 2009-14, Software (Topic 985): Certain Revenue Arrangements That Include Software Elements, and ASU 2009-13, Revenue Recognition (Topic 605): Multiple-Deliverable Revenue Arrangements. As summarized in ASU 2009-14, ASC Topic 985 has been amended to remove from the scope of industry-specific revenue accounting guidance for software and software related transactions tangible products containing software components and non-software components that function together to deliver the products essential functionality. As summarized in ASU 2009-13, ASC Topic 605 has been amended: (1) to provide updated guidance on whether multiple deliverables exist, how the deliverables in an arrangement should be separated, and the consideration allocated; (2) to require an entity to allocate revenue in an arrangement using estimated selling prices of deliverables if a vendor does not have vendor-specific objective evidence or third-party evidence of selling price; and (3) to eliminate the use of the residual method and require an entity to allocate revenue using the relative selling price method. The accounting changes summarized in ASU 2009-14 and ASU 2009-13 are both effective for fiscal years beginning on or after June 15, 2010, with early adoption permitted. Adoption may either be on a prospective basis or by retrospective application.
We adopted these amendments to the ASC on January 1, 2011 on a prospective basis as applicable to our revenue generated from licensing branded properties that are coupled with a service component, where we also purchase and distribute prizes on behalf of lottery authorities. The impact of these accounting changes was not material to our consolidated financial statements for the three months ended March 31, 2011.
Basic and Diluted Net (Loss) Income Per Share
The following represents a reconciliation of the numerator and denominator used in computing basic and diluted net (loss) income per share available to common stockholders for the three months ended March 31, 2011 and 2010:
Thre
Free historical financial statements for Light & Wonder, Inc.. See how revenue, income, cash flow, and balance sheet financials have changed over 61 quarters since 2011. Compare with LNW stock chart to see long term trends.
Data imported from Light & Wonder, Inc. SEC filings. Check original filings before making any investment decision.