Technology › Semiconductors And Related Devices

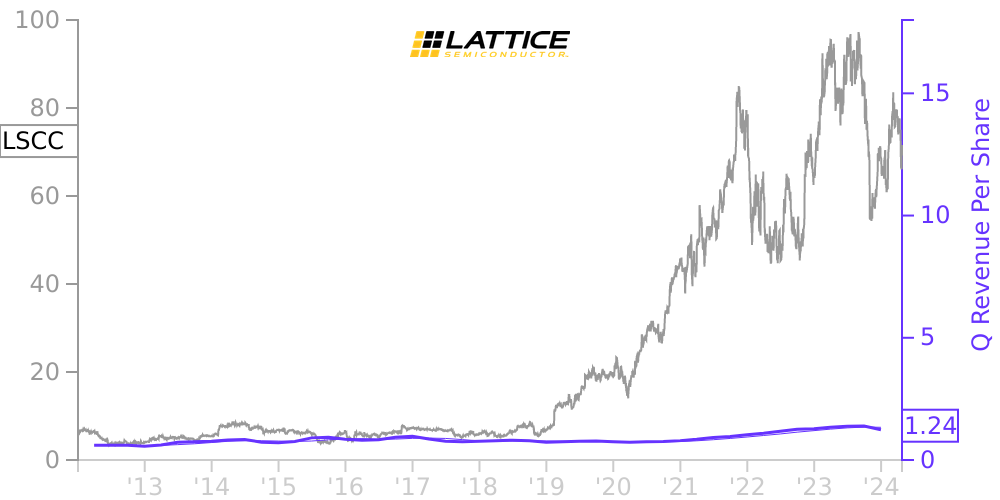
LSCC Stock Price Correlated With Lattice Semiconductor Financials
External Links ⌄
Income Statement
Cash Flow
Balance Sheet
LSCC Income Statement
Enable JavaScript and reload
Revenue, Net:
Cost of Goods & Services Sold:
Gross Profit:
Selling, General & Admin Expense:
Research & Development Expense:
Total Operating Expenses:
Operating Income:
Income Taxes:
Net Income:
LSCC Cash Flow
Enable JavaScript and reload
Operating Activities Net Income:
Depreciation, Depletion & Amortization:
Change in Accounts Receiveable:
Net Cash from Operations:
Repurchases/Buybacks Common Stock:
Issuance of Long-term Debt:
Cash Dividends Paid:
Net Cash from Financing Activities:
Property, Plant & Equipment Purchases:
Purchases of Businesses, Net of Cash:
Net Cash from Investing Activities:
Net Change in Cash & Equivalents:
LSCC Balance Sheet
Enable JavaScript and reload
Cash and Cash Equivalents:
Short-Term Investments:
Accounts Receivable, Net:
Inventories:
Total Current Assets:
Property, Plant & Equipment, Net:
Total Assets:
Accounts Payable:
Current Portion of Long-Term Debt:
Total Short-Term Liabilities:
Long Term Debt, Non-Current Portion:
Total Long-Term Liabilities:
Total Liabilities:
COMPANY PROFILE
Note 1 - Basis of Presentation and Significant Accounting Policies
Basis of Presentation and Use of Estimates
The accompanying Consolidated Financial Statements have been prepared in accordance with U.S. Generally Accepted Accounting Principles ("U.S. GAAP") and pursuant to the rules and regulations of the Securities and Exchange Commission ("SEC"). They include the accounts of Lattice and its subsidiaries after the elimination of all intercompany balances and transactions.
The preparation of financial statements in conformity with U.S. GAAP requires management to make estimates and judgments affecting the amounts reported in our consolidated financial statements and the accompanying notes. We base our estimates and judgments on historical experience, knowledge of current conditions, and our beliefs of what could occur in the future considering available information. While we believe that our estimates, assumptions, and judgments are reasonable, they are based on information available when made, and because of the uncertainty inherent in these matters, the actual results that we experience may differ materially from these estimates under different assumptions or conditions. We evaluate our estimates and judgments on an ongoing basis.
Certain prior year balances have been reclassified to conform to the current year’s presentation.
Fiscal Reporting Periods
We report based on a 52 or 53 -week fiscal year ending on the Saturday closest to December 31. Our fiscal 2021 was a 52 -week year that ended on January 1, 2022. Our fiscal 2020 was a 53 -week year that ended on January 2, 2021, and our fiscal 2019 was a 52 -week year that ended on December 28, 2019. All references to quarterly or annual financial results are references to the results for the relevant fiscal period.
Concentrations of Risk
Potential exposure to concentrations of risk may impact revenue, accounts receivable, a nd supply of wafers for our new products.
Distributors have historically accounted for a significant portion of our total revenue. Our two largest distributor groups, the Weikeng Group ("Weikeng") and Arrow Electronics, Inc. ("Arrow"), each account for more than 10% of our total revenue and our net accounts receivable. Revenue attributable to distributors as a percentage of total revenue is presented in the following table:
Year Ended
January 1, January 2, December 28,
2022 2021 2019
Weikeng Group 37 % 35 % 30 %
Arrow Electronics Inc. 27 25 25
Other distributors 23 23 27
Revenue attributable to distributors 87 % 83 % 82 %
At January 1, 2022 and January 2, 2021, Weikeng accounted for 59% and 47%, respectively, and Arrow accounted for 28% and 45%, respectively, of net accounts receivable.
Concentration of credit risk with respect to accounts receivable is mitigated by our credit and collection process including active management of collections, credit limits, routine credit evaluations for essentially all customers, and secure transactions with letters of credit or advance payments where appropriate. We regularly review our allowance for doubtful accounts and the aging of our accounts receivable.
We rely on a limited number of foundries for our wafer purchases. We seek to mitigate the concentration of supply risk by establishing, maintaining and managing multiple foundry relationships; however, certain of our products are sourced from a single foundry and changing from one foundry to another can have a significant cost, or create delays in production or shipments, among other factors.
Cash and Cash Equivalents
We consider all investments that are readily convertible into cash and that have original maturities of three months or less to be cash equivalents. Cash equivalents consist primarily of highly liquid investments in time deposits or money market accounts and are carried at cost, which approximates fair value. Deposits with financial institutions at times exceed Federal Deposit Insurance Corporation insurance limits.
Foreign Exchange and
Free historical financial statements for Lattice Semiconductor Corp. See how revenue, income, cash flow, and balance sheet financials have changed over 57 quarters since 2012. Compare with LSCC stock chart to see long term trends.
Data imported from Lattice Semiconductor Corp SEC filings. Check original filings before making any investment decision.