
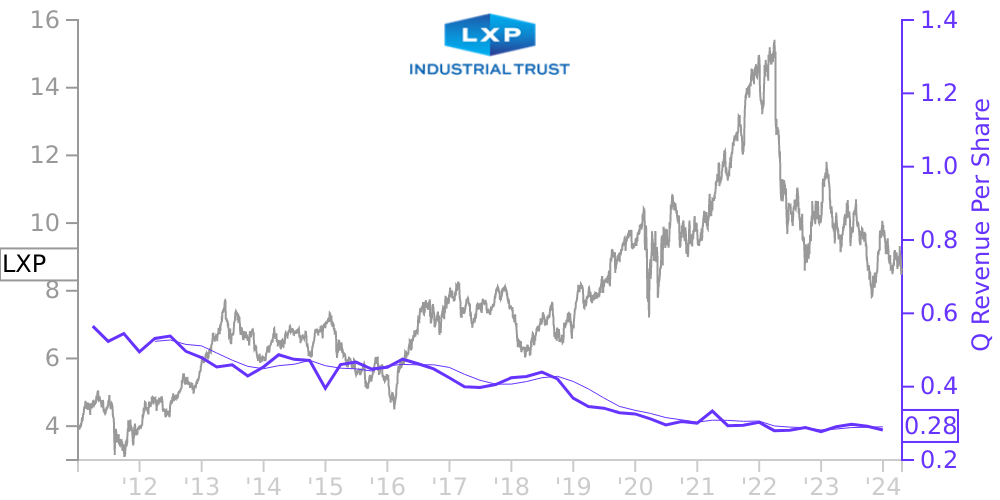
LXP Stock Price Correlated With Lexington Realty Trust Financials
External Links ⌄
Income Statement
Cash Flow
Balance Sheet
LXP Income Statement
Enable JavaScript and reload
Revenue, Net:
Cost of Goods & Services Sold:
Gross Profit:
Selling, General & Admin Expense:
Research & Development Expense:
Total Operating Expenses:
Operating Income:
Income Taxes:
Net Income:
LXP Cash Flow
Enable JavaScript and reload
Operating Activities Net Income:
Depreciation, Depletion & Amortization:
Change in Accounts Receiveable:
Net Cash from Operations:
Repurchases/Buybacks Common Stock:
Issuance of Long-term Debt:
Cash Dividends Paid:
Net Cash from Financing Activities:
Property, Plant & Equipment Purchases:
Purchases of Businesses, Net of Cash:
Net Cash from Investing Activities:
Net Change in Cash & Equivalents:
LXP Balance Sheet
Enable JavaScript and reload
Cash and Cash Equivalents:
Short-Term Investments:
Accounts Receivable, Net:
Inventories:
Total Current Assets:
Property, Plant & Equipment, Net:
Total Assets:
Accounts Payable:
Current Portion of Long-Term Debt:
Total Short-Term Liabilities:
Long Term Debt, Non-Current Portion:
Total Long-Term Liabilities:
Total Liabilities:
COMPANY PROFILE
The Company LXP Industrial Trust (together with its consolidated subsidiaries, except when the context only applies to the parent entity, the “Company”) is a Maryland real estate investment trust (“REIT”) that owns a portfolio of equity investments focused on single-tenant industrial properties.
As of December 31, 2021, the Company had equity ownership interests in approximately 121 consolidated properties located in 23 states. The properties in which the Company has an interest are primarily net leased to tenants in various industries.
The Company believes it has qualified as a REIT under the Internal Revenue Code of 1986, as amended (the “Code”). Accordingly, the Company will not be subject to federal income tax, provided that distributions to its shareholders equal at least the amount of its REIT taxable income as defined under the Code. The Company is permitted to participate in certain activities from which it was previously precluded in order to maintain its qualification as a REIT, so long as these activities are conducted in entities which elect to be treated as taxable REIT subsidiaries (“TRS”) under the Code. As such, the TRS are subject to federal income taxes on the income from these activities.
The Company conducts its operations indirectly through (1) property owner subsidiaries, which are single purpose entities, (2) a wholly-owned TRS, Lexington Realty Advisors, Inc. (“LRA”), and (3) joint ventures. Property owner subsidiaries are landlords under leases for properties in which the Company has an interest and/or borrowers under loan agreements secured by properties in which the Company has an interest and lender subsidiaries are lenders under loan agreements where the Company made an investment in a loan asset, but in all cases are separate and distinct legal entities. Each property owner subsidiary is a separate legal entity that maintains separate books and records. The assets and credit of each property owner subsidiary with a property subject to a mortgage loan are not available to creditors to satisfy the debt and other obligations of any other person, including any other property owner subsidiary or any other affiliate. Consolidated entities that are not property owner subsidiaries do not directly own any of the assets of a property owner subsidiary (or the general partner, member or managing member of such property owner subsidiary), but merely hold partnership, membership or beneficial interest therein, which interests are subordinate to the claims of such property owner subsidiary's (or its general partner's, member's or managing member's) creditors.
Free historical financial statements for Lexington Realty Trust. See how revenue, income, cash flow, and balance sheet financials have changed over 61 quarters since 2011. Compare with LXP stock chart to see long term trends.
Data imported from Lexington Realty Trust SEC filings. Check original filings before making any investment decision.