Consumer Discretionary › Retail-Department Stores

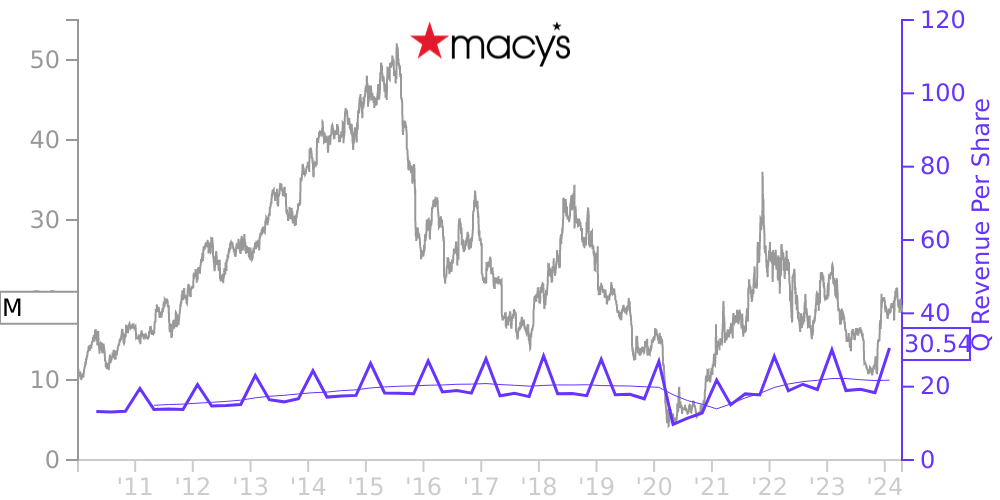
M Stock Price Correlated With Macy's Financials
External Links ⌄
Income Statement
Cash Flow
Balance Sheet
M Income Statement
Enable JavaScript and reload
Revenue, Net:
Cost of Goods & Services Sold:
Gross Profit:
Selling, General & Admin Expense:
Research & Development Expense:
Total Operating Expenses:
Operating Income:
Income Taxes:
Net Income:
M Cash Flow
Enable JavaScript and reload
Operating Activities Net Income:
Depreciation, Depletion & Amortization:
Change in Accounts Receiveable:
Net Cash from Operations:
Repurchases/Buybacks Common Stock:
Issuance of Long-term Debt:
Cash Dividends Paid:
Net Cash from Financing Activities:
Property, Plant & Equipment Purchases:
Purchases of Businesses, Net of Cash:
Net Cash from Investing Activities:
Net Change in Cash & Equivalents:
M Balance Sheet
Enable JavaScript and reload
Cash and Cash Equivalents:
Short-Term Investments:
Accounts Receivable, Net:
Inventories:
Total Current Assets:
Property, Plant & Equipment, Net:
Total Assets:
Accounts Payable:
Current Portion of Long-Term Debt:
Total Short-Term Liabilities:
Long Term Debt, Non-Current Portion:
Total Long-Term Liabilities:
Total Liabilities:
COMPANY PROFILE
1.
Organization and Summary of Significant Accounting Policies
Nature of Operations
Macy’s, Inc., together with its subsidiaries (the “Company”), is an omnichannel retail organization operating stores, websites and mobile applications under three brands (Macy’s, Bloomingdale’s and bluemercury) that sell a wide range of merchandise, including apparel and accessories (men's, women's and kids'), cosmetics, home furnishings and other consumer goods. The Company has stores in 43 states, the District of Columbia, Puerto Rico and Guam. As of January 29, 2022, the Company’s operations and operating segments were conducted through Macy’s, Market by Macy’s, Macy's Backstage, Bloomingdale’s, Bloomingdale’s The Outlet, Bloomies, and bluemercury, which are aggregated into one reporting segment in accordance with the Financial Accounting Standards Board (“FASB”) Accounting Standards Codification (“ASC”) Topic 280, Segment Reporting. The metrics used by management to assess the performance of the Company’s operating divisions include sales trends, gross margin rates, expense rates, and rates of earnings before interest and taxes (“EBIT”) and earnings before interest, taxes, depreciation and amortization (“EBITDA”). The Company’s operating divisions have historically had similar economic characteristics and are expected to have similar economic characteristics and long-term financial performance in future periods.
Bloomingdale's in Dubai, United Arab Emirates and Al Zahra, Kuwait are operated under a license agreement with Al Tayer Insignia, a company of Al Tayer Group, LLC.
Fiscal Y ear
The Company’s fiscal year ends on the Saturday closest to January 31. Fiscal years 2021, 2020 and 2019 ended on January 29, 2022, January 30, 2021 and February 1, 2020, respectively, and included 52 weeks. References to years in the Consolidated Financial Statements relate to fiscal years rather than calendar years.
Basis of Presentation
The Consolidated Financial Statements include the accounts of Macy's, Inc. and its 100%-owned subsidiaries.
Use of Estimates
The preparation of financial statements in conformity with accounting principles generally accepted in the United States of America requires management to make estimates and assumptions that affect the reported amounts of assets and liabilities and disclosure of contingent assets and liabilities at the date of the financial statements and the reported amounts of revenues and expenses during the reporting period. Such estimates and assumptions are subject to inherent uncertainties which may result in actual amounts differing from reported amounts.
Net Sales
Revenue is recognized when customers obtain control of goods and services promised by the Company. The amount of revenue recognized is based on the amount that reflects the consideration that is expected to be received in exchange for those respective goods and services. See Note 2, Revenue, for further discussion of the Company's accounting policies for revenue from contracts with customers.
Cost of Sales
Cost of sales consists of the cost of merchandise, including inbound freight, shipping and handling costs, and depreciation. An estimated allowance for future sales returns is recorded and cost of sales is adjusted accordingly.
Cash and Cash Equivalents
Cash and cash equivalents include cash and liquid investments with original maturities of three months or less. Cash and cash equivalents includes amounts due in respect of credit card sales transactions that are settled early in the following period in the amount of $102 million at January 29, 2022 and $92 million at January 30, 2021.
Investments
The Company from time to time invests in debt and equity securities, including companies engaged in complementary businesses. All debt securities held by the Company are accounted for under ASC Topic 320, Investments – Debt Securities, while all marketable securities held by the Company are accounted for under ASC Topic 321, Investments – Equity Securitie
Free historical financial statements for Macy's Inc.. See how revenue, income, cash flow, and balance sheet financials have changed over 65 quarters since 2010. Compare with M stock chart to see long term trends.
Data imported from Macy's Inc. SEC filings. Check original filings before making any investment decision.