Consumer Discretionary › Hotels And Motels

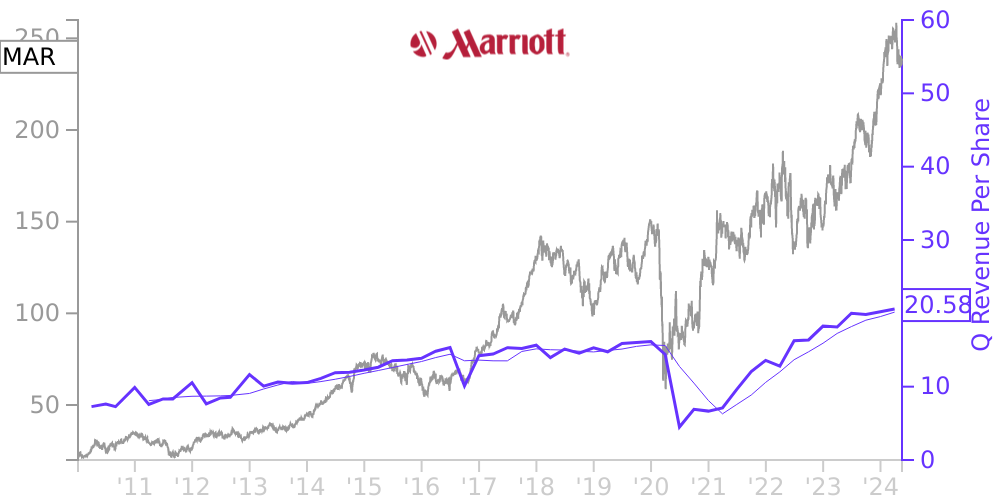
MAR Stock Price Correlated With Marriott International Financials
External Links ⌄
Income Statement
Cash Flow
Balance Sheet
MAR Income Statement
Enable JavaScript and reload
Revenue, Net:
Cost of Goods & Services Sold:
Gross Profit:
Selling, General & Admin Expense:
Research & Development Expense:
Total Operating Expenses:
Operating Income:
Income Taxes:
Net Income:
MAR Cash Flow
Enable JavaScript and reload
Operating Activities Net Income:
Depreciation, Depletion & Amortization:
Change in Accounts Receiveable:
Net Cash from Operations:
Repurchases/Buybacks Common Stock:
Issuance of Long-term Debt:
Cash Dividends Paid:
Net Cash from Financing Activities:
Property, Plant & Equipment Purchases:
Purchases of Businesses, Net of Cash:
Net Cash from Investing Activities:
Net Change in Cash & Equivalents:
MAR Balance Sheet
Enable JavaScript and reload
Cash and Cash Equivalents:
Short-Term Investments:
Accounts Receivable, Net:
Inventories:
Total Current Assets:
Property, Plant & Equipment, Net:
Total Assets:
Accounts Payable:
Current Portion of Long-Term Debt:
Total Short-Term Liabilities:
Long Term Debt, Non-Current Portion:
Total Long-Term Liabilities:
Total Liabilities:
COMPANY PROFILE
BASIS OF PRESENTATION The condensed consolidated financial statements present the results of operations, financial position, and cash flows of Marriott International, Inc. and subsidiaries (referred to in this report as “we,” “us,” “Marriott,” or the “Company”). In order to make this report easier to read, we also refer throughout to (1) our Condensed Consolidated Financial Statements as our “Financial Statements,” (2) our Condensed Consolidated Statements of Income (Loss) as our “Income Statements,” (3) our Condensed Consolidated Balance Sheets as our “Balance Sheets,” (4) our Condensed Consolidated Statements of Cash Flows as our “Statements of Cash Flows,” (5) our properties, brands, or markets in the United States and Canada as “U.S. & Canada,” and (6) our properties, brands, or markets in our Caribbean and Latin America, Europe, Middle East and Africa, Greater China, and Asia Pacific excluding China regions, as “International.” In addition, references throughout to numbered “Notes” refer to these Notes to Condensed Consolidated Financial Statements, unless otherwise stated.
These Financial Statements have not been audited. We have condensed or omitted certain information and disclosures normally included in financial statements presented in accordance with U.S. generally accepted accounting principles (“GAAP”). The financial statements in this report should be read in conjunction with the consolidated financial statements and notes thereto in our Annual Report on Form 10-K for the fiscal year ended December 31, 2021 (“2021 Form 10-K”). Certain terms not otherwise defined in this Form 10-Q have the meanings specified in our 2021 Form 10-K.
Preparation of financial statements that conform with GAAP requires management to make estimates and assumptions that affect the reported amounts of assets and liabilities as of the date of the financial statements, the reported amounts of revenues and expenses during the reporting periods, and the disclosures of contingent liabilities. The uncertainty created by the coronavirus pandemic and efforts to contain it (“COVID-19”) has made such estimates more difficult and subjective. Accordingly, ultimate results could differ from those estimates.
The accompanying Financial Statements reflect all normal and recurring adjustments necessary to present fairly our financial position as of March 31, 2022 and December 31, 2021, the results of our operations for the three months ended March 31, 2022 and March 31, 2021, and cash flows for the three months ended March 31, 2022 and March 31, 2021. Interim results may not be indicative of fiscal year performance because of seasonal and short-term variations, as well as the impact of COVID-19. We have eliminated all material intercompany transactions and balances between entities consolidated in these Financial Statements.
Free historical financial statements for Marriott International Inc. See how revenue, income, cash flow, and balance sheet financials have changed over 65 quarters since 2010. Compare with MAR stock chart to see long term trends.
Data imported from Marriott International Inc SEC filings. Check original filings before making any investment decision.