Industrials › Nonferrous Foundries (Castings)

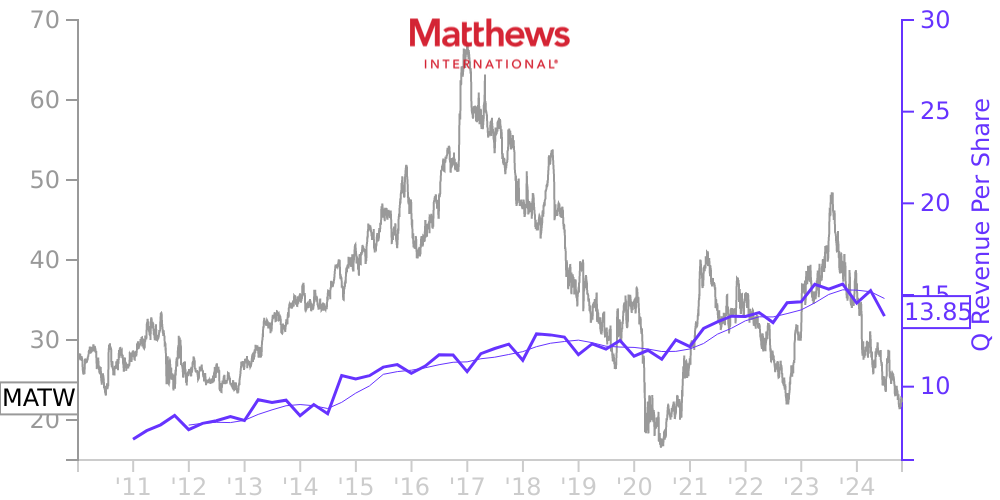
MATW Stock Price Correlated With Matthews International Financials
External Links ⌄
Income Statement
Cash Flow
Balance Sheet
MATW Income Statement
Enable JavaScript and reload
Revenue, Net:
Cost of Goods & Services Sold:
Gross Profit:
Selling, General & Admin Expense:
Research & Development Expense:
Total Operating Expenses:
Operating Income:
Income Taxes:
Net Income:
MATW Cash Flow
Enable JavaScript and reload
Operating Activities Net Income:
Depreciation, Depletion & Amortization:
Change in Accounts Receiveable:
Net Cash from Operations:
Repurchases/Buybacks Common Stock:
Issuance of Long-term Debt:
Cash Dividends Paid:
Net Cash from Financing Activities:
Property, Plant & Equipment Purchases:
Purchases of Businesses, Net of Cash:
Net Cash from Investing Activities:
Net Change in Cash & Equivalents:
MATW Balance Sheet
Enable JavaScript and reload
Cash and Cash Equivalents:
Short-Term Investments:
Accounts Receivable, Net:
Inventories:
Total Current Assets:
Property, Plant & Equipment, Net:
Total Assets:
Accounts Payable:
Current Portion of Long-Term Debt:
Total Short-Term Liabilities:
Long Term Debt, Non-Current Portion:
Total Long-Term Liabilities:
Total Liabilities:
COMPANY PROFILE
Basis of PresentationThe accompanying unaudited consolidated financial statements have been prepared in accordance with generally accepted accounting principles ("GAAP") for interim financial information for commercial and industrial companies and the instructions to Form 10-Q and Rule 10-01 of Regulation S-X. Accordingly, they do not include all of the information and footnotes required by GAAP for complete financial statements. The year-end consolidated balance sheet data was derived from audited financial statements, but does not include all disclosures required by GAAP. In the opinion of management, all adjustments (consisting of normal recurring accruals) considered necessary for fair presentation have been included. Operating results for the six months ended March 31, 2022 are not necessarily indicative of the results that may be expected for the fiscal year ending September 30, 2022. For further information, refer to the consolidated financial statements and footnotes thereto included in the Company's Annual Report on Form 10-K for the year ended September 30, 2021. The consolidated financial statements include all domestic and foreign subsidiaries in which the Company maintains an ownership interest and has operating control and any variable interest entities for which the Company is the primary beneficiary. Investments in certain companies over which the Company exerts significant influence, but does not control the financial and operating decisions, are accounted for as equity method investments. Investments in certain companies over which the Company does not exert significant influence are accounted for as cost method investments. All intercompany accounts and transactions have been eliminated.The preparation of financial statements in conformity with GAAP requires management to make estimates and assumptions that affect the reported amounts of assets and liabilities and disclosure of contingent assets and liabilities at the date of the financial statements and the reported amounts of revenues and expenses during the reporting period. Actual results could differ from those estimates.
Free historical financial statements for Matthews International Corp. See how revenue, income, cash flow, and balance sheet financials have changed over 62 quarters since 2010. Compare with MATW stock chart to see long term trends.
Data imported from Matthews International Corp SEC filings. Check original filings before making any investment decision.