Technology › Semiconductors And Related Devices

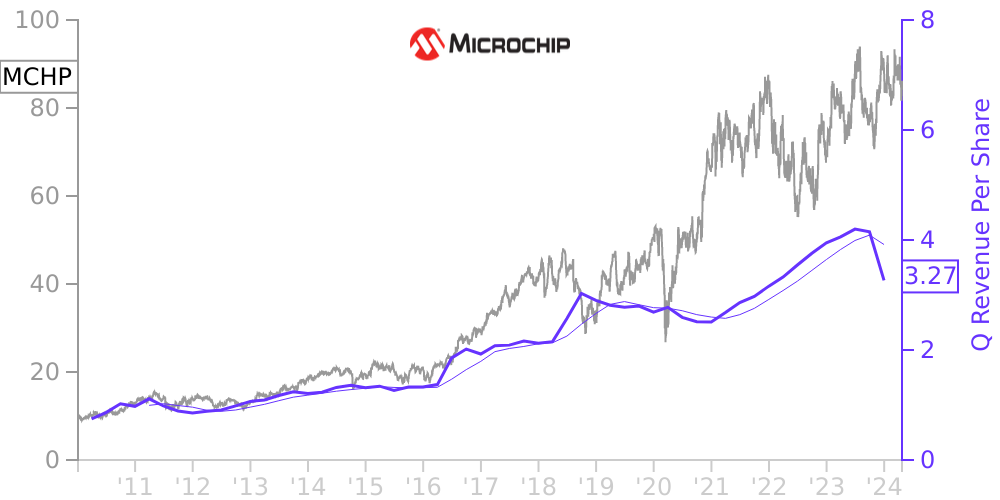
MCHP Stock Price Correlated With Microchip Technology Financials
External Links ⌄
Income Statement
Cash Flow
Balance Sheet
MCHP Income Statement
Enable JavaScript and reload
Revenue, Net:
Cost of Goods & Services Sold:
Gross Profit:
Selling, General & Admin Expense:
Research & Development Expense:
Total Operating Expenses:
Operating Income:
Income Taxes:
Net Income:
MCHP Cash Flow
Enable JavaScript and reload
Operating Activities Net Income:
Depreciation, Depletion & Amortization:
Change in Accounts Receiveable:
Net Cash from Operations:
Repurchases/Buybacks Common Stock:
Issuance of Long-term Debt:
Cash Dividends Paid:
Net Cash from Financing Activities:
Property, Plant & Equipment Purchases:
Purchases of Businesses, Net of Cash:
Net Cash from Investing Activities:
Net Change in Cash & Equivalents:
MCHP Balance Sheet
Enable JavaScript and reload
Cash and Cash Equivalents:
Short-Term Investments:
Accounts Receivable, Net:
Inventories:
Total Current Assets:
Property, Plant & Equipment, Net:
Total Assets:
Accounts Payable:
Current Portion of Long-Term Debt:
Total Short-Term Liabilities:
Long Term Debt, Non-Current Portion:
Total Long-Term Liabilities:
Total Liabilities:
COMPANY PROFILE
Basis of Presentation The accompanying unaudited condensed consolidated financial statements include the accounts of Microchip Technology Incorporated and its majority-owned and controlled subsidiaries (the Company). All significant intercompany accounts and transactions have been eliminated in consolidation. All dollar amounts in the financial statements and tables in these notes, except per share amounts, are stated in millions of U.S. dollars unless otherwise noted.
The accompanying unaudited condensed consolidated financial statements have been prepared in accordance with U.S. GAAP, pursuant to the rules and regulations of the SEC. The information furnished herein reflects all adjustments which are, in the opinion of management, of a normal recurring nature and necessary for a fair statement of the results for the interim periods reported. Certain information and footnote disclosures normally included in audited consolidated financial statements have been condensed or omitted pursuant to such SEC rules and regulations. It is suggested that these condensed consolidated financial statements be read in conjunction with the audited consolidated financial statements and the notes thereto included in the Company's Annual Report on Form 10-K for the fiscal year ended March 31, 2022. The results of operations for the three months ended June 30, 2022 are not necessarily indicative of the results that may be expected for the fiscal year ending March 31, 2023 or for any other period.
On August 24, 2021, at our Annual Meeting of Stockholders, our stockholders approved a two-for-one forward stock split and the amendment and restatement of the Company's Certificate of Incorporation to increase the number of authorized shares of common stock from 450.0 million shares to 900.0 million shares. As a result, each stockholder of record at the close of market on October 4, 2021 received one additional share of common stock for every share held. Such shares were distributed after the close of trading on October 12, 2021. All share, equity award, and per share amounts and related shareholders' equity balances presented herein have been adjusted to reflect the stock split.
Free historical financial statements for Microchip Technology Inc. See how revenue, income, cash flow, and balance sheet financials have changed over 68 quarters since 2009. Compare with MCHP stock chart to see long term trends.
Data imported from Microchip Technology Inc SEC filings. Check original filings before making any investment decision.