Industrials › Metal Forging And Stampings

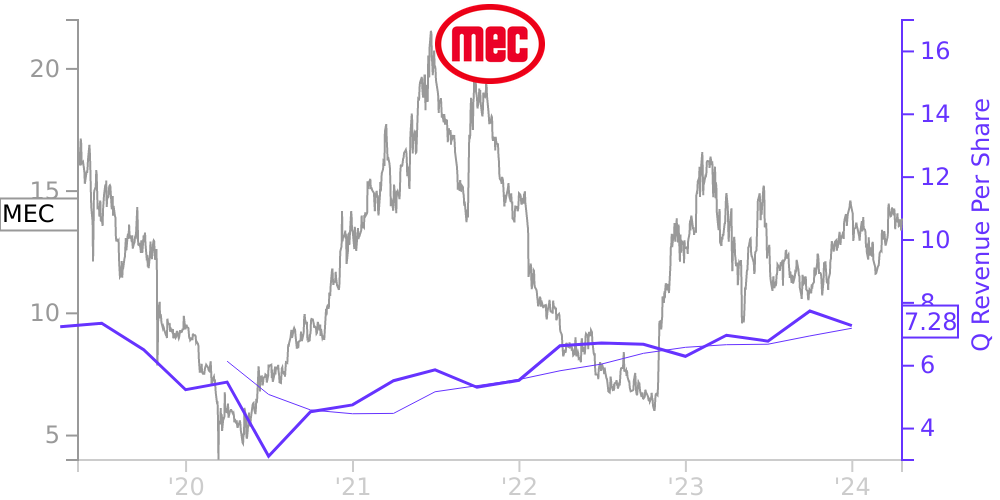
MEC Stock Price Correlated With Mayville Engineering Company Financials
External Links ⌄
Income Statement
Cash Flow
Balance Sheet
MEC Income Statement
Enable JavaScript and reload
Revenue, Net:
Cost of Goods & Services Sold:
Gross Profit:
Selling, General & Admin Expense:
Research & Development Expense:
Total Operating Expenses:
Operating Income:
Income Taxes:
Net Income:
MEC Cash Flow
Enable JavaScript and reload
Operating Activities Net Income:
Depreciation, Depletion & Amortization:
Change in Accounts Receiveable:
Net Cash from Operations:
Repurchases/Buybacks Common Stock:
Issuance of Long-term Debt:
Cash Dividends Paid:
Net Cash from Financing Activities:
Property, Plant & Equipment Purchases:
Purchases of Businesses, Net of Cash:
Net Cash from Investing Activities:
Net Change in Cash & Equivalents:
MEC Balance Sheet
Enable JavaScript and reload
Cash and Cash Equivalents:
Short-Term Investments:
Accounts Receivable, Net:
Inventories:
Total Current Assets:
Property, Plant & Equipment, Net:
Total Assets:
Accounts Payable:
Current Portion of Long-Term Debt:
Total Short-Term Liabilities:
Long Term Debt, Non-Current Portion:
Total Long-Term Liabilities:
Total Liabilities:
COMPANY PROFILE
Note 1. Nature of business and summary of significant accounting policies
Mayville Engineering Company, Inc. and subsidiaries (MEC, the Company, we, our, us or similar terms) is a leading U.S.-based value-added manufacturing partner that provides a broad range of prototyping and tooling, production fabrication, coating, assembly and aftermarket components. Our customers operate in diverse end markets, including heavy- and medium-duty commercial vehicle, construction & access equipment, powersports, agriculture, military and other end markets. Founded in 1945 and headquartered in Mayville, Wisconsin, we are a leading Tier I U.S. supplier of highly engineered components to original equipment manufacturers (OEM) customers with leading positions in their respective markets. The Company operates 20 facilities, of which 19 are in operation, located in Arkansas, Michigan, Mississippi, Ohio, Pennsylvania, Virginia, and Wisconsin. Our engineering expertise and technical know-how allow us to add value through every product redevelopment cycle (generally every three to five years for our customers).
In December 1985, the Company formed the Mayville Engineering Company, Inc. Employee Stock Ownership Plan (ESOP). The ESOP is a tax qualified retirement plan and is designed to invest primarily in the Company’s common stock which is held in a Trust. From January 2003 until the Company’s IPO in May 2019, the ESOP owned 100% of the Company’s outstanding shares of common stock which have been fully allocated to active or retired eligible employees. In connection with the IPO, the Company initially sold 6,250,000 shares of common stock into the public market, reducing ESOP ownership to approximately 67%. As of December 31, 2021, 48.0% of all outstanding shares were held by the ESOP or within the Company’s 401(k) plan.
Basis of presentation and consolidation
The accompanying consolidated financial statements have been prepared in accordance with accounting principles generally accepted in the United States of America (GAAP). They include the accounts of the Company and its wholly-owned subsidiaries. All intercompany balances and transactions have been eliminated in consolidation.
Use of estimates
The preparation of consolidated financial statements in conformity with GAAP requires management to make certain estimates and assumptions that affect the reported amounts and disclosures. Accordingly, actual results could differ from those estimates.
Cash and cash equivalents
The Company considers all highly-liquid investments purchased with original maturities of 90 days or less to be cash and cash equivalents.
Concentration of credit risk
Financial instruments that potentially subject the Company to credit risk consist principally of bank balances above the Federal Deposit Insurance Corporation (FDIC) insurability limits of $250 per official custodian. The Company has not experienced any losses on these accounts and management believes the Company is not exposed to any significant credit risk on cash.
Accounts receivable
Accounts receivable are generally uncollateralized customer obligations due under normal trade terms requiring payment within 30 to 60 days from the invoice date. Management periodically reviews past due balances and established an allowance for doubtful accounts of approximately $631 and $1,298 as of December 31, 2021 and 2020, respectively, for probable uncollectible amounts based on its assessment of the current status of individual accounts. The estimated valuation allowance results in a charge to cost of sales and the accounts are written-off through a charge to the valuation allowance and a credit to accounts receivable after the Company has used all reasonable collection efforts.
Inventories
Inventories are stated at the lower of cost, determined on the first-in, first-out method (FIFO), and net realizable value. Net realizable value is the estimated selling price in the ordinary course of business, less reasonably predictable c
Free historical financial statements for Mayville Engineering Company Inc. See how revenue, income, cash flow, and balance sheet financials have changed over 29 quarters since 2019. Compare with MEC stock chart to see long term trends.
Data imported from Mayville Engineering Company Inc SEC filings. Check original filings before making any investment decision.