Materials › Mining, Quarrying Of Nonmetallic Minerals (No Fuels)

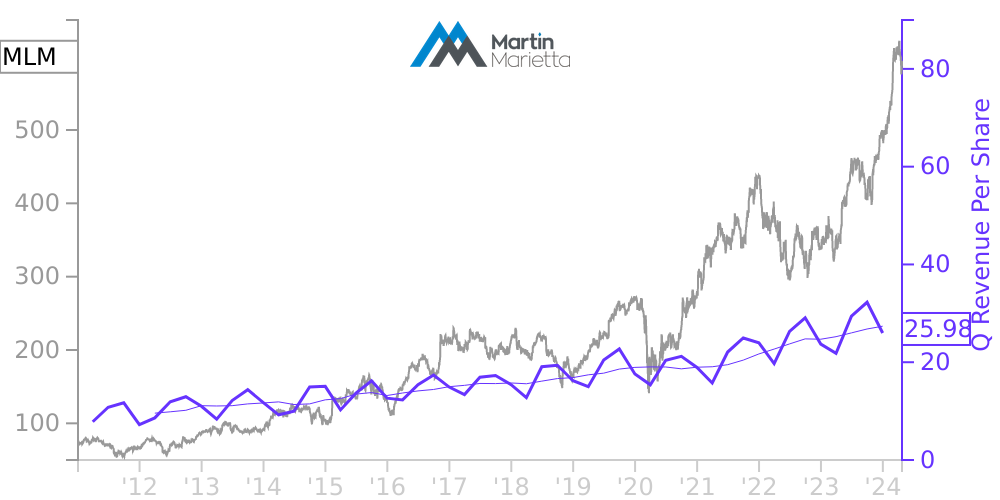
MLM Stock Price Correlated With Martin Marietta Materials Financials
External Links ⌄
Income Statement
Cash Flow
Balance Sheet
MLM Income Statement
Enable JavaScript and reload
Revenue, Net:
Cost of Goods & Services Sold:
Gross Profit:
Selling, General & Admin Expense:
Research & Development Expense:
Total Operating Expenses:
Operating Income:
Income Taxes:
Net Income:
MLM Cash Flow
Enable JavaScript and reload
Operating Activities Net Income:
Depreciation, Depletion & Amortization:
Change in Accounts Receiveable:
Net Cash from Operations:
Repurchases/Buybacks Common Stock:
Issuance of Long-term Debt:
Cash Dividends Paid:
Net Cash from Financing Activities:
Property, Plant & Equipment Purchases:
Purchases of Businesses, Net of Cash:
Net Cash from Investing Activities:
Net Change in Cash & Equivalents:
MLM Balance Sheet
Enable JavaScript and reload
Cash and Cash Equivalents:
Short-Term Investments:
Accounts Receivable, Net:
Inventories:
Total Current Assets:
Property, Plant & Equipment, Net:
Total Assets:
Accounts Payable:
Current Portion of Long-Term Debt:
Total Short-Term Liabilities:
Long Term Debt, Non-Current Portion:
Total Long-Term Liabilities:
Total Liabilities:
COMPANY PROFILE
Note A: Accounting Policies
Organization. Martin Marietta is a natural resource-based building materials company. The Company supplies aggregates (crushed stone, sand and gravel) through its network of approximately 350 quarries, mines and distribution yards in 28 states, Canada and The Bahamas. Martin Marietta also provides cement and downstream products, namely, ready mixed concrete, asphalt and paving services, in markets where the Company also has a leading aggregates position. Specifically, the Company has two cement plants and several cement distribution facilities in Texas; ready mixed concrete plants in Arizona, Colorado and Texas; and asphalt plants in Arizona, California, Colorado and Minnesota. Paving services are located in Colorado and California. In addition, the Company also has two cement plants, cement distribution terminals and ready mixed concrete operations in California that are classified as assets held for sale and discontinued operations as of December 31, 2021. The Company’s heavy-side building materials are used in infrastructure, nonresidential and residential construction projects. Aggregates are also used in agricultural, utility and environmental applications and as railroad ballast. The aggregates, cement, ready mixed concrete and asphalt and paving product lines are reported collectively as the Building Materials business.
As of December 31, 2021, the Building Materials business contains the following reportable segments: East Group and West Group. The East Group consists of the East and Central divisions and operates in Alabama, Florida, Georgia, Indiana, Iowa, Kansas, Kentucky, Maryland, Minnesota, Missouri, eastern Nebraska, North Carolina, Ohio, Pennsylvania, South Carolina, Tennessee, Virginia, West Virginia, Nova Scotia and The Bahamas. The West Group is comprised of the Southwest and West divisions and operates in Arizona, Arkansas, California, Colorado, Louisiana, western Nebraska, Oklahoma, Texas, Utah, Washington and Wyoming. In addition to these states, the Company sells to customers in New York, Delaware, New Mexico and Mississippi. The following states accounted for 68% of the Building Materials business’ 2021 total revenues: Texas, Colorado, North Carolina, Georgia and Minnesota.
The Company also operates a Magnesia Specialties business, which produces magnesia-based chemical products used in industrial, agricultural and environmental applications, and dolomitic lime sold primarily to customers for steel production and land stabilization. Magnesia Specialties’ production facilities are located in Ohio and Michigan, and products are shipped to customers worldwide. During 2021, there were no changes to the Magnesia Specialties reportable segment.
Basis of Presentation and Use of Estimates. The Company’s consolidated financial statements are presented in conformity with accounting principles generally accepted in the United States, which requires management to make certain estimates and assumptions about future events. These estimates and the underlying assumptions affect the amounts of assets and liabilities reported, disclosures about contingent assets and liabilities and reported amounts of revenues and expenses. Such estimates include the valuation of accounts receivable, inventories, goodwill, other intangible assets and other long-lived assets as well as assumptions used in the calculation of income tax expense, retirement and postemployment benefits, stock-based compensation, the allocation of the purchase price to the fair values of assets acquired and liabilities assumed as part of business combinations and revenue recognition for service contracts. These estimates and assumptions are based on management’s judgment. Management evaluates estimates and assumptions on an ongoing basis using historical experience and other factors, including the current economic environment, and adjusts such estimates and assumptions when facts and circumstances dictate. Changes in credit, equ
Free historical financial statements for Martin Marietta Materials Inc. See how revenue, income, cash flow, and balance sheet financials have changed over 61 quarters since 2011. Compare with MLM stock chart to see long term trends.
Data imported from Martin Marietta Materials Inc SEC filings. Check original filings before making any investment decision.