Industrials › Services-Business Services, Nec

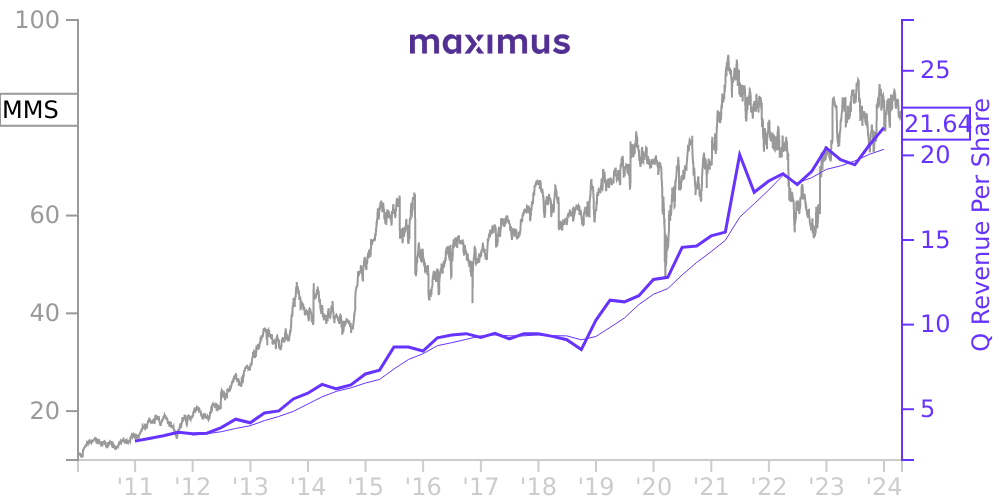
MMS Stock Price Correlated With Maximus Financials
External Links ⌄
Income Statement
Cash Flow
Balance Sheet
MMS Income Statement
Enable JavaScript and reload
Revenue, Net:
Cost of Goods & Services Sold:
Gross Profit:
Selling, General & Admin Expense:
Research & Development Expense:
Total Operating Expenses:
Operating Income:
Income Taxes:
Net Income:
MMS Cash Flow
Enable JavaScript and reload
Operating Activities Net Income:
Depreciation, Depletion & Amortization:
Change in Accounts Receiveable:
Net Cash from Operations:
Repurchases/Buybacks Common Stock:
Issuance of Long-term Debt:
Cash Dividends Paid:
Net Cash from Financing Activities:
Property, Plant & Equipment Purchases:
Purchases of Businesses, Net of Cash:
Net Cash from Investing Activities:
Net Change in Cash & Equivalents:
MMS Balance Sheet
Enable JavaScript and reload
Cash and Cash Equivalents:
Short-Term Investments:
Accounts Receivable, Net:
Inventories:
Total Current Assets:
Property, Plant & Equipment, Net:
Total Assets:
Accounts Payable:
Current Portion of Long-Term Debt:
Total Short-Term Liabilities:
Long Term Debt, Non-Current Portion:
Total Long-Term Liabilities:
Total Liabilities:
COMPANY PROFILE
ORGANIZATION Maximus, a Virginia corporation established in 1975, is a leading provider of government services worldwide. Maximus operates under its founding mission of Helping Government Serve the People ® , enabling citizens around the globe to successfully engage with their governments at all levels and across a variety of health and human services programs. Maximus delivers innovative business process management and technology solutions that contribute to improved outcomes for citizens and higher levels of productivity, accuracy, accountability, and efficiency of government-sponsored programs. Maximus is a proud partner to government agencies in the United States, Australia, Canada, Italy, Saudi Arabia, Singapore, South Korea, Sweden, and the United Kingdom.
Free historical financial statements for Maximus Inc. See how revenue, income, cash flow, and balance sheet financials have changed over 62 quarters since 2010. Compare with MMS stock chart to see long term trends.
Data imported from Maximus Inc SEC filings. Check original filings before making any investment decision.