Consumer Discretionary › Services-Automotive Repair, Services And Parking

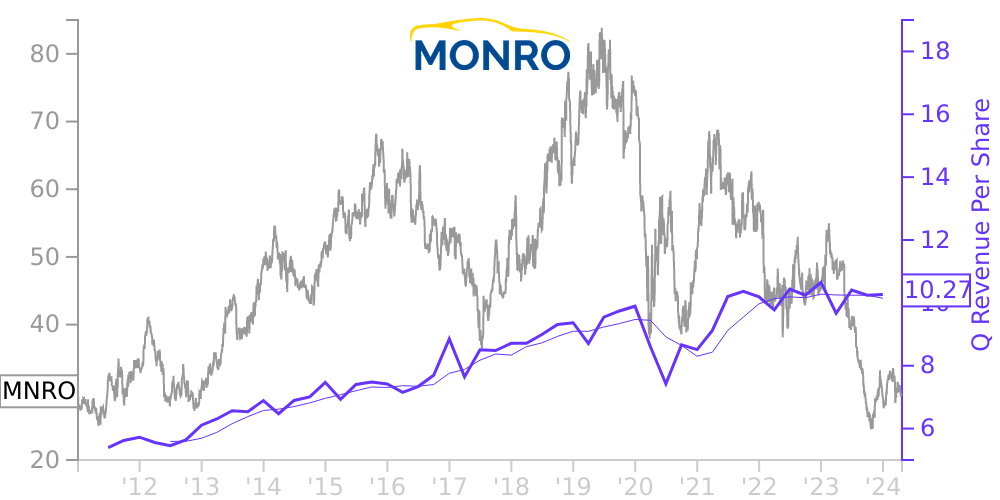
MNRO Stock Price Correlated With Monro Financials
External Links ⌄
Income Statement
Cash Flow
Balance Sheet
MNRO Income Statement
Enable JavaScript and reload
Revenue, Net:
Cost of Goods & Services Sold:
Gross Profit:
Selling, General & Admin Expense:
Research & Development Expense:
Total Operating Expenses:
Operating Income:
Income Taxes:
Net Income:
MNRO Cash Flow
Enable JavaScript and reload
Operating Activities Net Income:
Depreciation, Depletion & Amortization:
Change in Accounts Receiveable:
Net Cash from Operations:
Repurchases/Buybacks Common Stock:
Issuance of Long-term Debt:
Cash Dividends Paid:
Net Cash from Financing Activities:
Property, Plant & Equipment Purchases:
Purchases of Businesses, Net of Cash:
Net Cash from Investing Activities:
Net Change in Cash & Equivalents:
MNRO Balance Sheet
Enable JavaScript and reload
Cash and Cash Equivalents:
Short-Term Investments:
Accounts Receivable, Net:
Inventories:
Total Current Assets:
Property, Plant & Equipment, Net:
Total Assets:
Accounts Payable:
Current Portion of Long-Term Debt:
Total Short-Term Liabilities:
Long Term Debt, Non-Current Portion:
Total Long-Term Liabilities:
Total Liabilities:
COMPANY PROFILE
Note 1 – Description of Business and Basis of Presentation Description of business Monro, Inc. and its direct and indirect subsidiaries (together, “Monro”, the “Company”, “we”, “us”, or “our”), are engaged principally in providing automotive undercar repair and tire replacement sales and tire related services in the United States. Monro had 1,303 Company-operated retail stores located in 32 states and 80 franchised locations as of June 25, 2022. A certain number of our retail locations also service commercial customers. Our locations that serve commercial customers generally operate consistently with our other retail locations, except that the sales mix for these locations includes a higher number of commercial tires. Monro’s operations are organized and managed as one single segment designed to offer to our customers replacement tires and tire related services, automotive undercar repair services as well as a broad range of routine maintenance services, primarily on passenger cars, light trucks and vans. We also provide other products and services for brakes; mufflers and exhaust systems; and steering, drive train, suspension and wheel alignment. Basis of presentation The accompanying unaudited condensed consolidated financial statements have been prepared in accordance with the rules and regulations of the Securities and Exchange Commission (“SEC”) applicable to interim financial statements. While these statements reflect all adjustments (consisting of items of a normal recurring nature) that are, in the opinion of management, necessary for a fair statement of the results of the interim period, they do not include all of the information and footnotes required by United States generally accepted accounting principles (“U.S. GAAP”) for complete financial statement presentation. The consolidated financial statements should be read in conjunction with the financial statement disclosures in our Form 10-K for the fiscal year ended March 26, 2022. We use the same significant accounting policies in preparing quarterly and annual financial statements. For a description of our significant accounting policies followed in the preparation of the financial statements, see Note 1 of our Form 10-K for the fiscal year ended March 26, 2022. Due to the seasonal nature of our business, quarterly operating results and cash flows are not necessarily indicative of the results that may be expected for other interim periods or the full year. Fiscal year We operate on a 52/53 week fiscal year ending on the last Saturday in March. Fiscal years 2023 and 2022 each contain 52 weeks. Unless specifically indicated otherwise, any references to “2023” or “fiscal 2023” and “2022” or “fiscal 2022” relate to the years ending March 25, 2023 and March 26, 2022, respectively. Recent accounting pronouncements In October 2021, the Financial Accounting Standards Board (“FASB”) issued new accounting guidance which requires an acquiring entity to recognize and measure contract assets and contract liabilities acquired in a business combination as if they entered into the original contract at the same time and same date as the acquiree. This guidance is effective for fiscal years and interim periods within those years beginning after December 15, 2022. Early adoption is permitted. We are currently evaluating the impact of adopting this guidance. Other recent authoritative guidance issued by the FASB (including technical corrections to the Accounting Standards Codification) and the SEC did not or are not expected to have a material effect on our consolidated financial statements. Working capital management As part of our ongoing efforts to manage our working capital and improve our cash flow, we work with suppliers to optimize our purchasing terms and conditions, including extending payment terms. We also facilitate a voluntary supply chain financing program to provide some of our suppliers with the opportunity to sell receivables due from us (our accounts payable) to a p
Free historical financial statements for Monro Inc. See how revenue, income, cash flow, and balance sheet financials have changed over 60 quarters since 2011. Compare with MNRO stock chart to see long term trends.
Data imported from Monro Inc SEC filings. Check original filings before making any investment decision.