
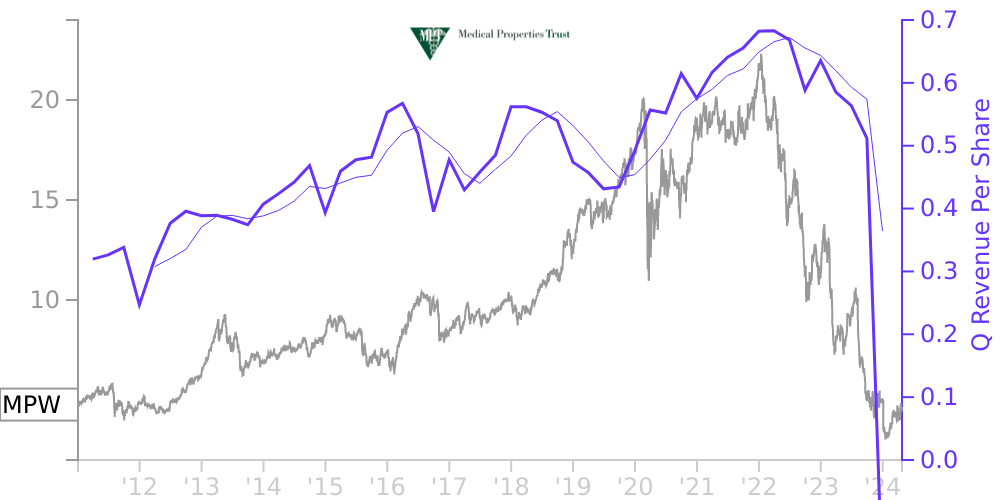
MPW Stock Price Correlated With Medical Properties Trust Financials
External Links ⌄
Income Statement
Cash Flow
Balance Sheet
MPW Income Statement
Enable JavaScript and reload
Revenue, Net:
Cost of Goods & Services Sold:
Gross Profit:
Selling, General & Admin Expense:
Research & Development Expense:
Total Operating Expenses:
Operating Income:
Income Taxes:
Net Income:
MPW Cash Flow
Enable JavaScript and reload
Operating Activities Net Income:
Depreciation, Depletion & Amortization:
Change in Accounts Receiveable:
Net Cash from Operations:
Repurchases/Buybacks Common Stock:
Issuance of Long-term Debt:
Cash Dividends Paid:
Net Cash from Financing Activities:
Property, Plant & Equipment Purchases:
Purchases of Businesses, Net of Cash:
Net Cash from Investing Activities:
Net Change in Cash & Equivalents:
MPW Balance Sheet
Enable JavaScript and reload
Cash and Cash Equivalents:
Short-Term Investments:
Accounts Receivable, Net:
Inventories:
Total Current Assets:
Property, Plant & Equipment, Net:
Total Assets:
Accounts Payable:
Current Portion of Long-Term Debt:
Total Short-Term Liabilities:
Long Term Debt, Non-Current Portion:
Total Long-Term Liabilities:
Total Liabilities:
COMPANY PROFILE
1. Organization
Medical Properties Trust, Inc., a Maryland corporation, was formed on August 27, 2003, under the Maryland General Corporation Law for the purpose of engaging in the business of investing in, owning, and leasing healthcare real estate. Our operating partnership subsidiary, MPT Operating Partnership, L.P. (the “Operating Partnership”), through which we conduct all of our operations, was formed in September 2003. At present, we own all of the partnership interests in the Operating Partnership and have elected to report our required disclosures and that of the Operating Partnership on a combined basis, except where material differences exist.
We operate as a real estate investment trust (“REIT”). Accordingly, we will generally not be subject to United States (“U.S.”) federal income tax, provided that we continue to qualify as a REIT and our distributions to our stockholders equal or exceed our taxable income. Certain non-real estate activities we undertake are conducted by entities which we elected to be treated as taxable REIT subsidiaries (“TRS”). Our TRS entities are subject to both U.S. federal and state income taxes. For our properties located outside the U.S., we are subject to the local taxes of the jurisdictions where our properties reside and/or legal entities are domiciled; however, we do not expect to incur additional taxes, of a significant nature, in the U.S. from foreign-based income as the majority of such income flows through our REIT.
Our primary business strategy is to acquire and develop real estate and improvements, primarily for long-term lease to providers of healthcare services, such as operators of general acute care hospitals, behavioral health facilities, inpatient physical rehabilitation hospitals, long-term acute care hospitals, and freestanding ER/urgent care facilities. We also make mortgage and other loans to operators of similar facilities. In addition, we may obtain profits or equity interests in our tenants, from time-to-time, in order to enhance our overall return.
Our business model facilitates acquisitions and recapitalizations, and allows operators of healthcare facilities to unlock the value of their real estate to fund facility improvements, technology upgrades, and other investments in operations. At December 31, 2021, we have investments in 438 facilities in 32 states in the U.S., in six countries in Europe, one country in South America, and across Australia. We manage our business as a single business segment.
Free historical financial statements for Medical Properties Trust Inc.. See how revenue, income, cash flow, and balance sheet financials have changed over 61 quarters since 2011. Compare with MPW stock chart to see long term trends.
Data imported from Medical Properties Trust Inc. SEC filings. Check original filings before making any investment decision.