Energy › Crude Petroleum And Natural Gas

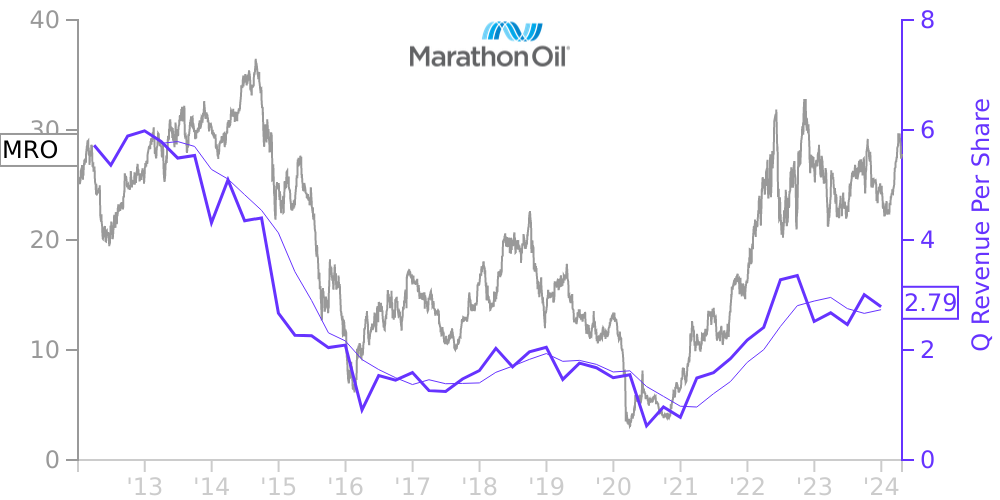
MRO Stock Price Correlated With Marathon Oil Financials
External Links ⌄
Income Statement
Cash Flow
Balance Sheet
MRO Income Statement
Enable JavaScript and reload
Revenue, Net:
Cost of Goods & Services Sold:
Gross Profit:
Selling, General & Admin Expense:
Research & Development Expense:
Total Operating Expenses:
Operating Income:
Income Taxes:
Net Income:
MRO Cash Flow
Enable JavaScript and reload
Operating Activities Net Income:
Depreciation, Depletion & Amortization:
Change in Accounts Receiveable:
Net Cash from Operations:
Repurchases/Buybacks Common Stock:
Issuance of Long-term Debt:
Cash Dividends Paid:
Net Cash from Financing Activities:
Property, Plant & Equipment Purchases:
Purchases of Businesses, Net of Cash:
Net Cash from Investing Activities:
Net Change in Cash & Equivalents:
MRO Balance Sheet
Enable JavaScript and reload
Cash and Cash Equivalents:
Short-Term Investments:
Accounts Receivable, Net:
Inventories:
Total Current Assets:
Property, Plant & Equipment, Net:
Total Assets:
Accounts Payable:
Current Portion of Long-Term Debt:
Total Short-Term Liabilities:
Long Term Debt, Non-Current Portion:
Total Long-Term Liabilities:
Total Liabilities:
COMPANY PROFILE
Basis of Presentation These consolidated financial statements are unaudited; however, in the opinion of management, these statements reflect all adjustments necessary for a fair statement of the results for the periods reported. All such adjustments are of a normal recurring nature unless disclosed otherwise. These consolidated financial statements, including notes, have been prepared in accordance with the applicable rules of the SEC and do not include all of the information and disclosures required by U.S. GAAP for complete financial statements.
These interim financial statements should be read in conjunction with the consolidated financial statements and notes thereto included in our 2021 Annual Report on Form 10-K. The results of operations for the first quarter of 2022 are not necessarily indicative of the results to be expected for the full year.
These interim financial statements should be read in conjunction with the consolidated financial statements and notes thereto included in our 2021 Annual Report on Form 10-K. The results of operations for the first quarter of 2022 are not necessarily indicative of the results to be expected for the full year.
Free historical financial statements for Marathon Oil Corp. See how revenue, income, cash flow, and balance sheet financials have changed over 51 quarters since 2012. Compare with MRO stock chart to see long term trends.
Data imported from Marathon Oil Corp SEC filings. Check original filings before making any investment decision.