Materials › MINERAL ROYALTY TRADERS

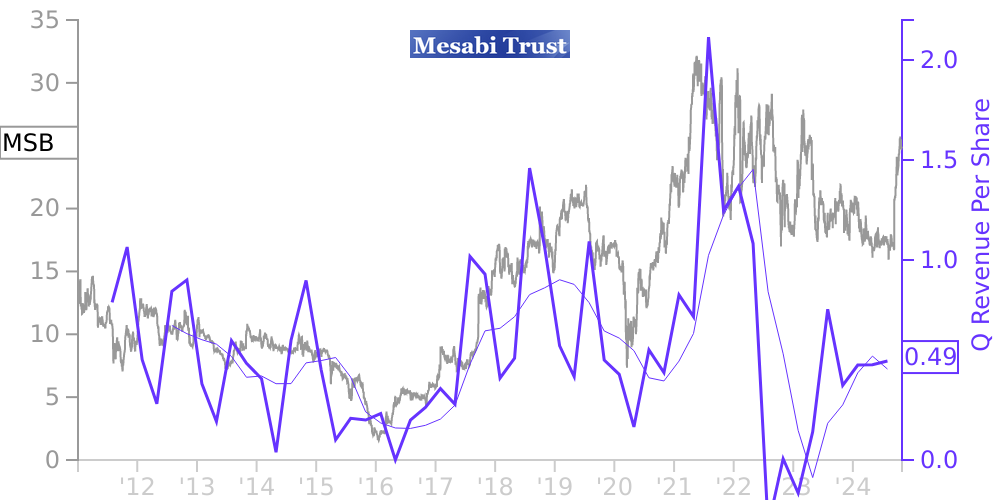
MSB Stock Price Correlated With Mesabi Trust Financials
External Links ⌄
Income Statement
Cash Flow
Balance Sheet
MSB Income Statement
Enable JavaScript and reload
Revenue, Net:
Cost of Goods & Services Sold:
Gross Profit:
Selling, General & Admin Expense:
Research & Development Expense:
Total Operating Expenses:
Operating Income:
Income Taxes:
Net Income:
MSB Cash Flow
Enable JavaScript and reload
Operating Activities Net Income:
Depreciation, Depletion & Amortization:
Change in Accounts Receiveable:
Net Cash from Operations:
Repurchases/Buybacks Common Stock:
Issuance of Long-term Debt:
Cash Dividends Paid:
Net Cash from Financing Activities:
Property, Plant & Equipment Purchases:
Purchases of Businesses, Net of Cash:
Net Cash from Investing Activities:
Net Change in Cash & Equivalents:
MSB Balance Sheet
Enable JavaScript and reload
Cash and Cash Equivalents:
Short-Term Investments:
Accounts Receivable, Net:
Inventories:
Total Current Assets:
Property, Plant & Equipment, Net:
Total Assets:
Accounts Payable:
Current Portion of Long-Term Debt:
Total Short-Term Liabilities:
Long Term Debt, Non-Current Portion:
Total Long-Term Liabilities:
Total Liabilities:
COMPANY PROFILE
Note 1. The financial statements and notes to the financial statements included herein have been prepared in accordance with the instructions to Form 10-Q pursuant to the rules and regulations of the Securities and Exchange Commission (the “SEC”). Certain information and footnote disclosures normally included in financial statements prepared in accordance with accounting principles generally accepted in the United States have been condensed or omitted pursuant to such rules and regulations. In the opinion of the Trustees, all adjustments, consisting only of normal recurring adjustments, necessary for a fair statement of (a) the results of operations for the three months ended April 30, 2022 and 2021, (b) the financial position as of April 30, 2022 and (c) the cash flows for the three months ended April 30, 2022 and 2021, have been made. For further information, refer to the financial statements and footnotes included in Mesabi Trust’s Annual Report on Form 10-K for the year ended January 31, 2022.
Free historical financial statements for Mesabi Trust. See how revenue, income, cash flow, and balance sheet financials have changed over 60 quarters since 2011. Compare with MSB stock chart to see long term trends.
Data imported from Mesabi Trust SEC filings. Check original filings before making any investment decision.