Industrials › Wholesale-Industrial Machinery And Equipment

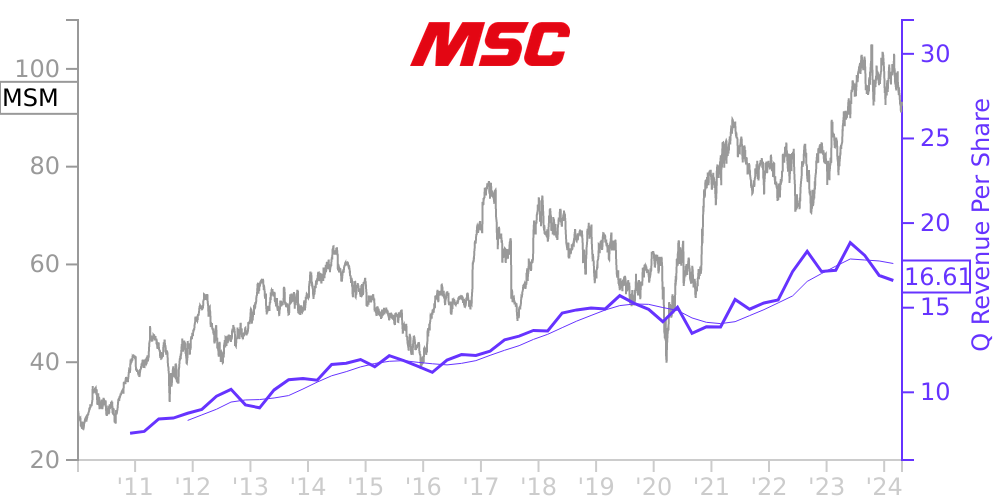
MSM Stock Price Correlated With MSC Industrial Direct Co. Financials
External Links ⌄
Income Statement
Cash Flow
Balance Sheet
MSM Income Statement
Enable JavaScript and reload
Revenue, Net:
Cost of Goods & Services Sold:
Gross Profit:
Selling, General & Admin Expense:
Research & Development Expense:
Total Operating Expenses:
Operating Income:
Income Taxes:
Net Income:
MSM Cash Flow
Enable JavaScript and reload
Operating Activities Net Income:
Depreciation, Depletion & Amortization:
Change in Accounts Receiveable:
Net Cash from Operations:
Repurchases/Buybacks Common Stock:
Issuance of Long-term Debt:
Cash Dividends Paid:
Net Cash from Financing Activities:
Property, Plant & Equipment Purchases:
Purchases of Businesses, Net of Cash:
Net Cash from Investing Activities:
Net Change in Cash & Equivalents:
MSM Balance Sheet
Enable JavaScript and reload
Cash and Cash Equivalents:
Short-Term Investments:
Accounts Receivable, Net:
Inventories:
Total Current Assets:
Property, Plant & Equipment, Net:
Total Assets:
Accounts Payable:
Current Portion of Long-Term Debt:
Total Short-Term Liabilities:
Long Term Debt, Non-Current Portion:
Total Long-Term Liabilities:
Total Liabilities:
COMPANY PROFILE
Note 1. Basis of Presentation The unaudited Condensed Consolidated Financial Statements have been prepared by the management of MSC Industrial Direct Co., Inc. (together with its wholly owned subsidiaries and entities in which it maintains a controlling financial interest, “MSC Industrial” or the “Company”) and in the opinion of management include all normal recurring adjustments necessary to present fairly the Company’s financial position as of May 28, 2022 and August 28, 2021 , results of operations for the thirteen and thirty-nine weeks ended May 28, 2022 and May 29, 2021 , and cash flows for the thirty-nine weeks ended May 28, 2022 and May 29, 2021 . The financial information as of August 28, 2021 was derived from the Company’s audited Consolidated Financial Statements included in the Company’s Annual Report on Form 10-K for the fiscal year ended August 28, 202 1 . Certain information and footnote disclosures normally included in financial statements prepared in accordance with accounting principles generally accepted in the United States of America have been condensed or omitted pursuant to the rules and regulations of the SEC. The Company, however, believes that the disclosures contained in this Report comply with the requirements of Section 13(a) of the Securities Exchange Act of 1934, as amended, for a Quarterly Report on Form 10-Q and are adequate to make the information presented not misleading. These unaudited Condensed Consolidated Financial Statements should be read in conjunction with the audited Consolidated Financial Statements and Notes thereto included in the Company’s Annual Report on Form 10-K for the fiscal year ended August 28, 202 1 . Fiscal Year The Company operates on a 52/53-week fiscal year ending on the Saturday closest to August 31 st of each year. References to “fiscal year 2022” refer to the period from August 29, 2021 to September 3, 2022, which is a 53-week fiscal year. References to “fiscal year 2021” refer to the period from August 30, 2020 to August 28, 2021, which is a 52-week fiscal year. The fiscal quarters ended May 28, 2022 and May 29, 2021 refer to the thirteen weeks ended as of those dates. Principles of Consolidation The unaudited Condensed Consolidated Financial Statements include the accounts of MSC Industrial Direct Co., Inc., its wholly owned subsidiaries and entities in which it maintains a controlling financial interest. All significant intercompany balances and transactions have been eliminated in consolidation. Impact of COVID-19 and Other Economic Trends The COVID-19 pandemic has impacted and may further impact the Company’s operations; however, demand from the Company’s traditional manufacturing end markets has recovered as certain restrictions implemented earlier in the pandemic have been lifted. In conjunction with the lifting of pandemic restrictions and economic recovery, the United States has experienced disruptions in the supply of certain products and services and disruptions in labor availability. These disruptions have contributed to a highly inflationary environment which has affected the price and, at times, the availability of certain products and services necessary for the Company’s operations, including fuel, labor and certain products the Company sells or the inputs for such products. Such disruptions have impacted, and may continue to impact in the future, the Company’s business, financial condition and results of operations. These disruptions are also impacting the Company’s customers and their ability to conduct their business or purchase the Company’s products and services. As a result of recent high inflation, increasing freight and fuel costs, and supply chain disruptions, the Company has implemented price realization strategies in response to increased costs the Company faces. Furthermore, in light of disruptions to availability and increased or uncertain shipping times, the Company is maintaining higher purchasing levels to ensure sufficient inventory
Free historical financial statements for MSC Industrial Direct Co. Inc.. See how revenue, income, cash flow, and balance sheet financials have changed over 63 quarters since 2010. Compare with MSM stock chart to see long term trends.
Data imported from MSC Industrial Direct Co. Inc. SEC filings. Check original filings before making any investment decision.