Industrials › Water, Sewer, Pipeline, Comm And Power Line Construction

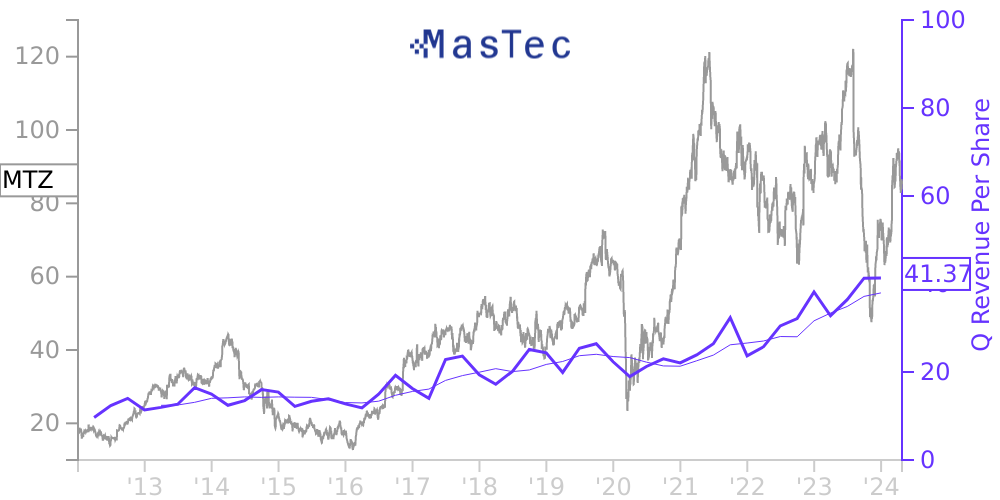
MTZ Stock Price Correlated With MasTec Financials
External Links ⌄
Income Statement
Cash Flow
Balance Sheet
MTZ Income Statement
Enable JavaScript and reload
Revenue, Net:
Cost of Goods & Services Sold:
Gross Profit:
Selling, General & Admin Expense:
Research & Development Expense:
Total Operating Expenses:
Operating Income:
Income Taxes:
Net Income:
MTZ Cash Flow
Enable JavaScript and reload
Operating Activities Net Income:
Depreciation, Depletion & Amortization:
Change in Accounts Receiveable:
Net Cash from Operations:
Repurchases/Buybacks Common Stock:
Issuance of Long-term Debt:
Cash Dividends Paid:
Net Cash from Financing Activities:
Property, Plant & Equipment Purchases:
Purchases of Businesses, Net of Cash:
Net Cash from Investing Activities:
Net Change in Cash & Equivalents:
MTZ Balance Sheet
Enable JavaScript and reload
Cash and Cash Equivalents:
Short-Term Investments:
Accounts Receivable, Net:
Inventories:
Total Current Assets:
Property, Plant & Equipment, Net:
Total Assets:
Accounts Payable:
Current Portion of Long-Term Debt:
Total Short-Term Liabilities:
Long Term Debt, Non-Current Portion:
Total Long-Term Liabilities:
Total Liabilities:
COMPANY PROFILE
Business, Basis of Presentation and Significant Accounting Policies Nature of the Business
MasTec, Inc. (collectively with its subsidiaries, “MasTec” or the “Company”) is a leading infrastructure construction company operating mainly throughout North America across a range of industries. The Company’s primary activities include the engineering, building, installation, maintenance and upgrade of communications, energy, utility and other infrastructure, such as: power delivery services, including transmission and distribution, wireless, wireline/fiber and customer fulfillment activities; power generation, primarily from clean energy and renewable sources; pipeline infrastructure, including natural gas pipeline and distribution infrastructure; heavy civil; and industrial infrastructure. MasTec’s customers are primarily in these industries. MasTec reports its results under five reportable segments: (1) Communications; (2) Clean Energy and Infrastructure; (3) Oil and Gas; (4) Power Delivery; and (5) Other. During the fourth quarter of 2021, the Company renamed its Electrical Transmission segment as the Power Delivery segment to better represent the nature of the segment’s operations, end markets and customer characteristics, including from the effects of the Company’s recent acquisitions. There was no change to the composition of the segment or its historical results.
Principles of Consolidation
The accompanying consolidated financial statements include MasTec, Inc. and its subsidiaries and include the accounts of all majority owned subsidiaries over which the Company exercises control and, when applicable, entities in which the Company has a controlling financial interest. All significant intercompany balances and transactions have been eliminated in consolidation. Other parties’ interests in entities that MasTec consolidates are reported as non-controlling interests within equity, except for mandatorily redeemable non-controlling interests, which are recorded within other liabilities. Net income or loss attributable to non-controlling interests is reported as a separate line item below net income or loss. The Company applies the equity method of accounting for its investments in entities for which it does not have a controlling financial interest, but over which it has the ability to exert significant influence. For equity investees in which the Company has an undivided interest in the assets, liabilities and profits or losses of an unincorporated entity, but does not exercise control over the entity, the Company consolidates its proportional interest in the accounts of the entity. When necessary, certain prior year amounts have been reclassified to conform with the current period presentation.
Translation of Foreign Currencies
The assets and liabilities of foreign subsidiaries with a functional currency other than the U.S. dollar are translated into U.S. dollars at period-end exchange rates, with resulting translation gains or losses included within other comprehensive income or loss. Revenue and expenses are translated into U.S. dollars at average rates of exchange during the applicable period. Substantially all of the Company’s foreign operations use their local currency as their functional currency. For foreign operations for which the local currency is not the functional currency, the operation’s non-monetary assets are remeasured into U.S. dollars at historical exchange rates. All other accounts are remeasured at current exchange rates. Gains or losses from remeasurement are included in other income or expense, net. Currency gains or losses resulting from transactions executed in currencies other than the functional currency are included in other income or expense, net.
In these consolidated financial statements, “$” means U.S. dollars unless otherwise noted.
Management Estimates
The preparation of consolidated financial statements in accordance with U.S. GAAP requires the use of estimates and assum
Free historical financial statements for MasTec Inc.. See how revenue, income, cash flow, and balance sheet financials have changed over 57 quarters since 2012. Compare with MTZ stock chart to see long term trends.
Data imported from MasTec Inc. SEC filings. Check original filings before making any investment decision.