Technology › Semiconductors And Related Devices

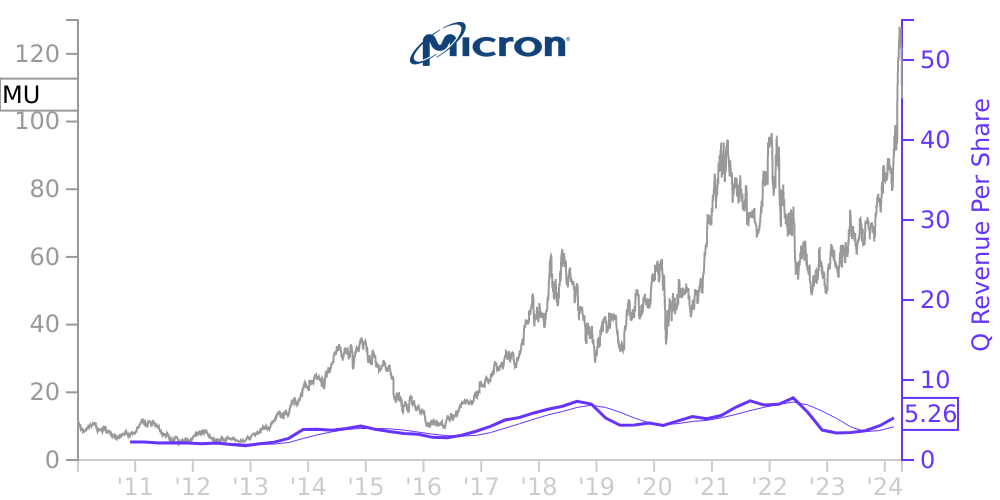
MU Stock Price Correlated With Micron Technology Financials
External Links ⌄
Income Statement
Cash Flow
Balance Sheet
MU Income Statement
Enable JavaScript and reload
Revenue, Net:
Cost of Goods & Services Sold:
Gross Profit:
Selling, General & Admin Expense:
Research & Development Expense:
Total Operating Expenses:
Operating Income:
Income Taxes:
Net Income:
MU Cash Flow
Enable JavaScript and reload
Operating Activities Net Income:
Depreciation, Depletion & Amortization:
Change in Accounts Receiveable:
Net Cash from Operations:
Repurchases/Buybacks Common Stock:
Issuance of Long-term Debt:
Cash Dividends Paid:
Net Cash from Financing Activities:
Property, Plant & Equipment Purchases:
Purchases of Businesses, Net of Cash:
Net Cash from Investing Activities:
Net Change in Cash & Equivalents:
MU Balance Sheet
Enable JavaScript and reload
Cash and Cash Equivalents:
Short-Term Investments:
Accounts Receivable, Net:
Inventories:
Total Current Assets:
Property, Plant & Equipment, Net:
Total Assets:
Accounts Payable:
Current Portion of Long-Term Debt:
Total Short-Term Liabilities:
Long Term Debt, Non-Current Portion:
Total Long-Term Liabilities:
Total Liabilities:
COMPANY PROFILE
Business and Basis of Presentation
Micron Technology, Inc. and its consolidated subsidiaries (hereinafter referred to collectively as "we," "our," "us" and similar terms unless the context indicates otherwise) is a global manufacturer and marketer of semiconductor devices, principally DRAM, NAND Flash and NOR Flash memory, as well as other innovative memory technologies, packaging solutions and semiconductor systems for use in leading-edge computing, consumer, networking, embedded and mobile products. In addition, we manufacture CMOS image sensors and other semiconductor products. The accompanying consolidated financial statements have been prepared in accordance with accounting principles generally accepted in the United States of America consistent in all material respects with those applied in our Annual Report on Form 10-K for the year ended September 1, 2011. In the opinion of our management, the accompanying unaudited consolidated financial statements contain all adjustments necessary to present fairly our consolidated financial position and our consolidated results of operations and cash flows. Certain reclassifications have been made to prior period amounts to conform to current period presentation.
Our fiscal year is the 52 or 53-week period ending on the Thursday closest to August 31. Our first quarters of fiscal 2012 and 2011 ended on December 1, 2011 and December 2, 2010, respectively. Our fiscal 2011 ended on September 1, 2011. All period references are to our fiscal periods unless otherwise indicated. These interim financial statements should be read in conjunction with the consolidated financial statements and accompanying notes included in our Annual Report on Form 10-K for the year ended September 1, 2011.
Free historical financial statements for Micron Technology Inc. See how revenue, income, cash flow, and balance sheet financials have changed over 64 quarters since 2009. Compare with MU stock chart to see long term trends.
Data imported from Micron Technology Inc SEC filings. Check original filings before making any investment decision.