Industrials › Water, Sewer, Pipeline, Comm And Power Line Construction

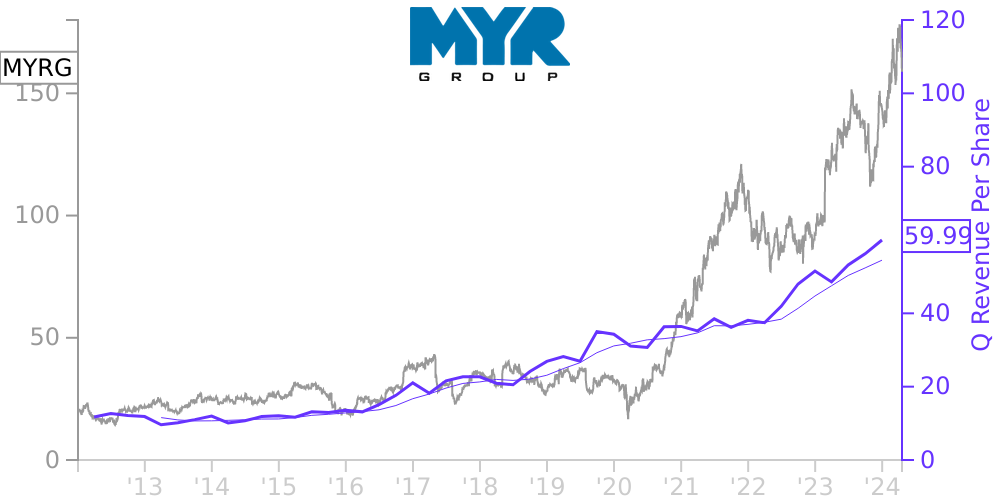
MYRG Stock Price Correlated With MYR Financials
External Links ⌄
Income Statement
Cash Flow
Balance Sheet
MYRG Income Statement
Enable JavaScript and reload
Revenue, Net:
Cost of Goods & Services Sold:
Gross Profit:
Selling, General & Admin Expense:
Research & Development Expense:
Total Operating Expenses:
Operating Income:
Income Taxes:
Net Income:
MYRG Cash Flow
Enable JavaScript and reload
Operating Activities Net Income:
Depreciation, Depletion & Amortization:
Change in Accounts Receiveable:
Net Cash from Operations:
Repurchases/Buybacks Common Stock:
Issuance of Long-term Debt:
Cash Dividends Paid:
Net Cash from Financing Activities:
Property, Plant & Equipment Purchases:
Purchases of Businesses, Net of Cash:
Net Cash from Investing Activities:
Net Change in Cash & Equivalents:
MYRG Balance Sheet
Enable JavaScript and reload
Cash and Cash Equivalents:
Short-Term Investments:
Accounts Receivable, Net:
Inventories:
Total Current Assets:
Property, Plant & Equipment, Net:
Total Assets:
Accounts Payable:
Current Portion of Long-Term Debt:
Total Short-Term Liabilities:
Long Term Debt, Non-Current Portion:
Total Long-Term Liabilities:
Total Liabilities:
COMPANY PROFILE
Organization, Business and Significant Accounting Policies Organization and Business
MYR Group Inc. (the “Company”) is a holding company of specialty electrical construction service providers and is currently conducting operations through wholly owned subsidiaries. The Company performs construction services in two business segments: Transmission and Distribution (“T&D”) and Commercial and Industrial (“C&I”). T&D customers include investor-owned utilities, cooperatives, private developers, government-funded utilities, independent power producers, independent transmission companies, industrial facility owners and other contractors. T&D provides a broad range of services, which include design, engineering, procurement, construction, upgrade, maintenance and repair services, with a particular focus on construction, maintenance and repair. C&I customers include general contractors, commercial and industrial facility owners, government agencies and developers. C&I provides a broad range of services, which include design, installation, maintenance and repair of commercial and industrial wiring, the installation of traffic networks and the installation of bridge, roadway and tunnel lighting.
Significant Accounting Policies
Consolidation
The accompanying Financial Statements include the results of operations of the Company and its subsidiaries. Significant intercompany transactions and balances have been eliminated. Certain reclassifications were made to prior year amounts to conform to the current year presentation.
Revenue Recognition
The Company recognizes revenue to depict the transfer of goods or services to customers in an amount that reflects the consideration the Company expects to be entitled to in exchange for goods or services provided. Revenue associated with contracts with customers is recognized over time as the Company’s performance creates or enhances customer-controlled assets or creates or enhances an asset with no alternative use, for which the Company has an enforceable right to receive compensation as defined under the contract. To determine the amount of revenue to recognize over time, the Company estimates profit by determining the difference between total estimated revenue and total estimated cost of a contract. In addition, the Company estimates a cost accrual every quarter that represents unbilled invoicing activity for services performed by subcontractors and suppliers during the quarter, and estimates revenue from the contract cost portion of this accrual based on current gross margin rates to be consistent with its cost method of revenue recognition. The estimated value of unbilled amounts are determined using a regression analysis that estimates value based on the Company’s historical experience, and is adjusted for large individual projects. The profit and corresponding revenue is recognized over the contract term based on costs incurred under the cost-to-cost method. The Company utilizes the cost-to-cost method as it believes cost incurred best represents the amount of work completed and remaining on projects, and is the most common basis for computing percentage of completion in the industry. For purposes of recognizing revenue, the Company follows the five-step approach outlined in Accounting Standards Codification (“ASC”) 606-10-25.
As the cost-to-cost method is driven by incurred cost, the Company calculates the percentage of completion by dividing costs incurred to date by the total estimated cost. The percentage of completion is then multiplied by estimated revenues to determine inception-to-date revenue. Revenue recognized for the period is the current inception-to-date recognized revenue less the prior period inception-to-date recognized revenue. If a contract is projected to result in a loss, the entire contract loss is recognized in the period when the loss was first determined and the amount of the loss is updated in subsequent reporting periods. Because the Company’s billings are based
Free historical financial statements for MYR Group Inc.. See how revenue, income, cash flow, and balance sheet financials have changed over 57 quarters since 2012. Compare with MYRG stock chart to see long term trends.
Data imported from MYR Group Inc. SEC filings. Check original filings before making any investment decision.