
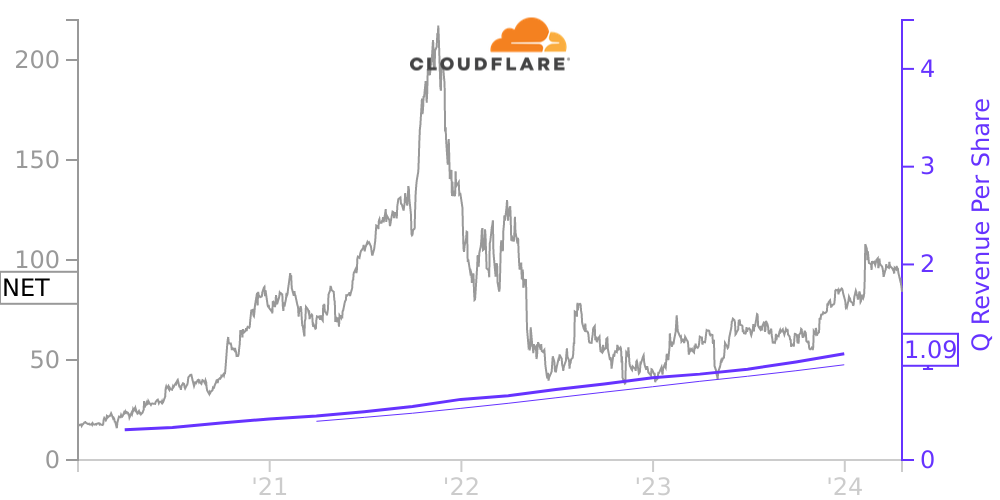
NET Stock Price Correlated With Cloudflare Financials
External Links ⌄
Income Statement
Cash Flow
Balance Sheet
NET Income Statement
Enable JavaScript and reload
Revenue, Net:
Cost of Goods & Services Sold:
Gross Profit:
Selling, General & Admin Expense:
Research & Development Expense:
Total Operating Expenses:
Operating Income:
Income Taxes:
Net Income:
NET Cash Flow
Enable JavaScript and reload
Operating Activities Net Income:
Depreciation, Depletion & Amortization:
Change in Accounts Receiveable:
Net Cash from Operations:
Repurchases/Buybacks Common Stock:
Issuance of Long-term Debt:
Cash Dividends Paid:
Net Cash from Financing Activities:
Property, Plant & Equipment Purchases:
Purchases of Businesses, Net of Cash:
Net Cash from Investing Activities:
Net Change in Cash & Equivalents:
NET Balance Sheet
Enable JavaScript and reload
Cash and Cash Equivalents:
Short-Term Investments:
Accounts Receivable, Net:
Inventories:
Total Current Assets:
Property, Plant & Equipment, Net:
Total Assets:
Accounts Payable:
Current Portion of Long-Term Debt:
Total Short-Term Liabilities:
Long Term Debt, Non-Current Portion:
Total Long-Term Liabilities:
Total Liabilities:
COMPANY PROFILE
Organization and Basis of Presentation Organization and Description of Business
Cloudflare, Inc. (the Company, Cloudflare, we, us, or our) is a global cloud services provider that delivers a broad range of services to businesses of all sizes and in all geographies, making them more secure, enhancing the performance of their business-critical applications, and eliminating the cost and complexity of managing individual network hardware. Cloudflare’s network serves as a scalable, easy-to-use, unified control plane to deliver security, performance, and reliability across on-premise, hybrid, cloud, and software-as-a-service (SaaS) applications. The Company was incorporated in Delaware in July 2009. The Company is headquartered in San Francisco, California.
Basis of Presentation and Principles of Consolidation
The accompanying consolidated financial statements and accompanying notes have been prepared in conformity with generally accepted accounting principles in the United States (U.S. GAAP) and include the accounts of the Company and its wholly-owned subsidiaries. All intercompany balances and transactions have been eliminated in consolidation. The Company’s fiscal year ends on December 31.
Initial Public Offering
In September 2019, the Company completed an initial public offering (IPO) in which it issued and sold Class A common stock for net proceeds of $565.0 million, after deducting underwriting discounts and commissions and offering costs. Upon completion of the IPO, all of the Company's outstanding redeemable convertible preferred stock was automatically converted into Class A common stock and Class B common stock. In addition, all of the outstanding warrants to purchase shares of the Company's redeemable convertible preferred stock were automatically converted into outstanding warrants to purchase shares of Class B common stock, and all of the shares of Class B common stock held by former employees were automatically converted into Class A common stock.
Use of Estimates
The preparation of consolidated financial statements in conformity with U.S. GAAP requires management to make estimates and assumptions that affect the amounts reported and disclosed in the consolidated financial statements and accompanying notes to the consolidated financial statements. Such estimates include, but are not limited to, allowance for doubtful accounts, deferred contract acquisitions costs, the period of benefit generated from the Company’s deferred contract acquisition costs, the capitalization and estimated useful life of internal-use software, the assessment of recoverability of intangible assets and their estimated useful lives, useful lives of property and equipment, liability and equity allocation of convertible senior notes, the determination of the incremental borrowing rate used for operating lease liabilities, the valuation and recognition of stock-based compensation expense, uncertain tax positions, and the recognition and measurement of current and deferred income tax assets and liabilities. Management bases these estimates and assumptions on historical experience and on various other assumptions that are believed to be reasonable. Due to the COVID-19 pandemic, there is ongoing uncertainty and significant disruption in the global economy and financial markets. The Company is not aware of any specific event or circumstance that would require an update to its estimates or assumptions or a revision of the carrying value of its assets or liabilities as of March 1, 2022, the date of issuance of this Annual Report on Form 10-K. These estimates and assumptions may change in the future, however, as new events occur and additional information is obtained . Actual results could differ materially from these estimates.
Free historical financial statements for Cloudflare Inc. See how revenue, income, cash flow, and balance sheet financials have changed over 25 quarters since 2020. Compare with NET stock chart to see long term trends.
Data imported from Cloudflare Inc SEC filings. Check original filings before making any investment decision.