Materials › Industrial Organic Chemicals

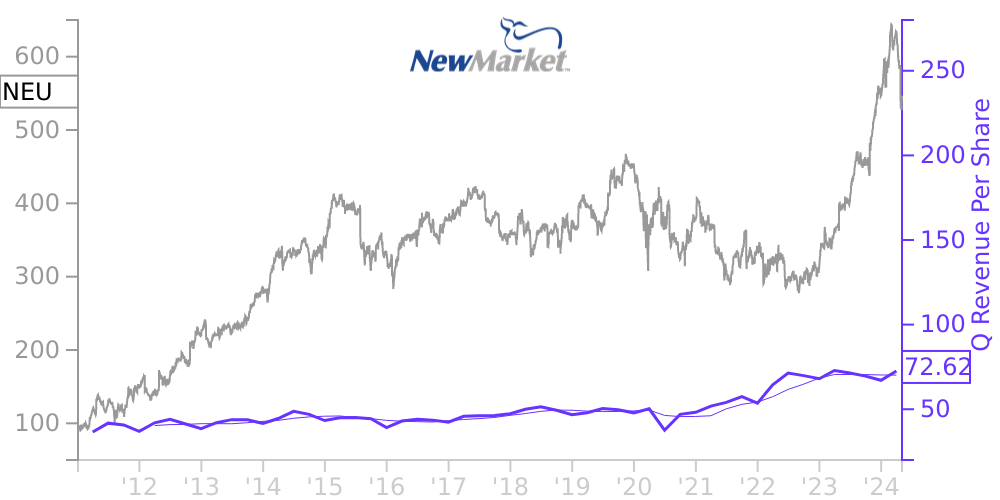
NEU Stock Price Correlated With NewMarket Financials
External Links ⌄
Income Statement
Cash Flow
Balance Sheet
NEU Income Statement
Enable JavaScript and reload
Revenue, Net:
Cost of Goods & Services Sold:
Gross Profit:
Selling, General & Admin Expense:
Research & Development Expense:
Total Operating Expenses:
Operating Income:
Income Taxes:
Net Income:
NEU Cash Flow
Enable JavaScript and reload
Operating Activities Net Income:
Depreciation, Depletion & Amortization:
Change in Accounts Receiveable:
Net Cash from Operations:
Repurchases/Buybacks Common Stock:
Issuance of Long-term Debt:
Cash Dividends Paid:
Net Cash from Financing Activities:
Property, Plant & Equipment Purchases:
Purchases of Businesses, Net of Cash:
Net Cash from Investing Activities:
Net Change in Cash & Equivalents:
NEU Balance Sheet
Enable JavaScript and reload
Cash and Cash Equivalents:
Short-Term Investments:
Accounts Receivable, Net:
Inventories:
Total Current Assets:
Property, Plant & Equipment, Net:
Total Assets:
Accounts Payable:
Current Portion of Long-Term Debt:
Total Short-Term Liabilities:
Long Term Debt, Non-Current Portion:
Total Long-Term Liabilities:
Total Liabilities:
COMPANY PROFILE
Financial Statement Presentation In the opinion of management, the accompanying consolidated financial statements of NewMarket Corporation and its subsidiaries contain all necessary adjustments for the fair presentation of, in all material respects, our consolidated financial position as of March 31, 2022 and December 31, 2021, and our consolidated results of operations, comprehensive income, and changes in shareholders' equity for the three months ended March 31, 2022 and March 31, 2021, and our cash flows for the three months ended March 31, 2022 and March 31, 2021. All adjustments are of a normal, recurring nature, unless otherwise disclosed. These financial statements should be read in conjunction with the consolidated financial statements and related notes included in the NewMarket Corporation Annual Report on Form 10-K for the year ended December 31, 2021 (2021 Annual Report), as filed with the Securities and Exchange Commission (SEC). The results of operations for the three month period ended March 31, 2022 are not necessarily indicative of the results to be expected for the full year ending December 31, 2022. The December 31, 2021 condensed consolidated balance sheet data was derived from audited financial statements, but does not include all disclosures required by accounting principles generally accepted in the United States of America.
Unless the context otherwise indicates, all references to “we,” “us,” “our,” the “company,” and “NewMarket” are to NewMarket Corporation and its consolidated subsidiaries.
Unless the context otherwise indicates, all references to “we,” “us,” “our,” the “company,” and “NewMarket” are to NewMarket Corporation and its consolidated subsidiaries.
Free historical financial statements for NewMarket Corp.. See how revenue, income, cash flow, and balance sheet financials have changed over 61 quarters since 2011. Compare with NEU stock chart to see long term trends.
Data imported from NewMarket Corp. SEC filings. Check original filings before making any investment decision.