Energy › Oil, Gas Field Services, Nbc

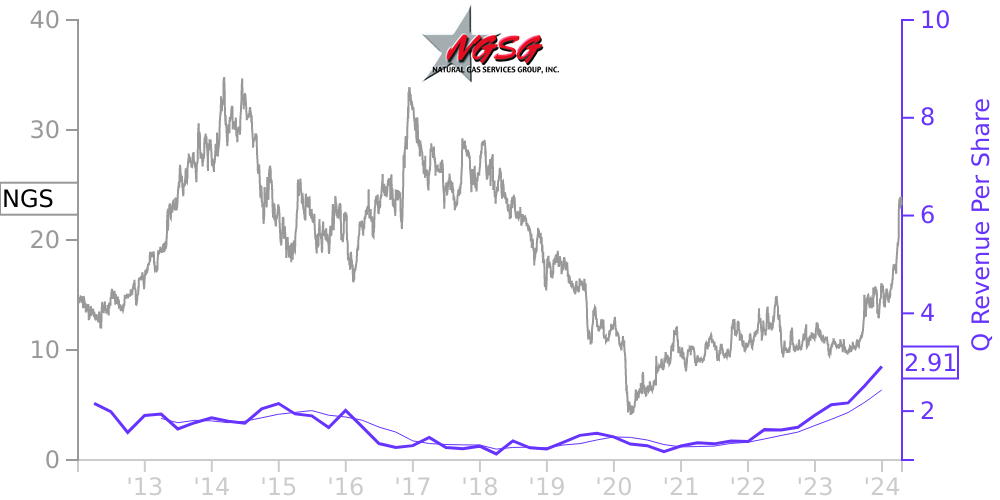
NGS Stock Price Correlated With Natural Gas Services Financials
External Links ⌄
Income Statement
Cash Flow
Balance Sheet
NGS Income Statement
Enable JavaScript and reload
Revenue, Net:
Cost of Goods & Services Sold:
Gross Profit:
Selling, General & Admin Expense:
Research & Development Expense:
Total Operating Expenses:
Operating Income:
Income Taxes:
Net Income:
NGS Cash Flow
Enable JavaScript and reload
Operating Activities Net Income:
Depreciation, Depletion & Amortization:
Change in Accounts Receiveable:
Net Cash from Operations:
Repurchases/Buybacks Common Stock:
Issuance of Long-term Debt:
Cash Dividends Paid:
Net Cash from Financing Activities:
Property, Plant & Equipment Purchases:
Purchases of Businesses, Net of Cash:
Net Cash from Investing Activities:
Net Change in Cash & Equivalents:
NGS Balance Sheet
Enable JavaScript and reload
Cash and Cash Equivalents:
Short-Term Investments:
Accounts Receivable, Net:
Inventories:
Total Current Assets:
Property, Plant & Equipment, Net:
Total Assets:
Accounts Payable:
Current Portion of Long-Term Debt:
Total Short-Term Liabilities:
Long Term Debt, Non-Current Portion:
Total Long-Term Liabilities:
Total Liabilities:
COMPANY PROFILE
Description of BusinessNatural Gas Services Group, Inc. (the "Company", “NGS”, "Natural Gas Services Group", "we" or "our") (a Colorado corporation), is a leading provider of natural gas compression equipment and services to the energy industry. The Company manufactures, fabricates, rents, sells and maintains natural gas compressors and flare systems for oil and natural gas production and plant facilities. NGS is headquartered in Midland, Texas, with fabrication facilities located in Tulsa, Oklahoma and Midland, Texas, and service facilities located in major oil and natural gas producing basins in the U.S. The Company was formed on December 17, 1998.
Free historical financial statements for Natural Gas Services Group Inc. See how revenue, income, cash flow, and balance sheet financials have changed over 57 quarters since 2012. Compare with NGS stock chart to see long term trends.
Data imported from Natural Gas Services Group Inc SEC filings. Check original filings before making any investment decision.