
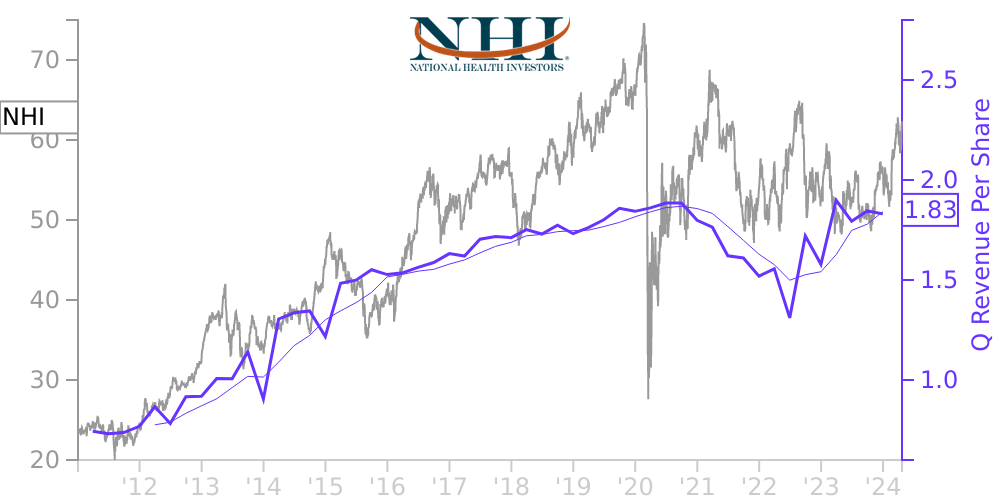
NHI Stock Price Correlated With National Health Investors Financials
External Links ⌄
Income Statement
Cash Flow
Balance Sheet
NHI Income Statement
Enable JavaScript and reload
Revenue, Net:
Cost of Goods & Services Sold:
Gross Profit:
Selling, General & Admin Expense:
Research & Development Expense:
Total Operating Expenses:
Operating Income:
Income Taxes:
Net Income:
NHI Cash Flow
Enable JavaScript and reload
Operating Activities Net Income:
Depreciation, Depletion & Amortization:
Change in Accounts Receiveable:
Net Cash from Operations:
Repurchases/Buybacks Common Stock:
Issuance of Long-term Debt:
Cash Dividends Paid:
Net Cash from Financing Activities:
Property, Plant & Equipment Purchases:
Purchases of Businesses, Net of Cash:
Net Cash from Investing Activities:
Net Change in Cash & Equivalents:
NHI Balance Sheet
Enable JavaScript and reload
Cash and Cash Equivalents:
Short-Term Investments:
Accounts Receivable, Net:
Inventories:
Total Current Assets:
Property, Plant & Equipment, Net:
Total Assets:
Accounts Payable:
Current Portion of Long-Term Debt:
Total Short-Term Liabilities:
Long Term Debt, Non-Current Portion:
Total Long-Term Liabilities:
Total Liabilities:
COMPANY PROFILE
Note 1. Organization and Nature of Business
National Health Investors, Inc. (“NHI,” “the Company,” “we,” “us” or “our”), established in 1991 as a Maryland corporation, is a self-managed real estate investment trust (“REIT”) specializing in sale-leaseback, joint venture, mortgage and mezzanine financing of need-driven and discretionary senior housing and medical facility investments. Our portfolio consists of lease, mortgage and other note investments in independent living facilities, assisted living facilities, entrance-fee communities, senior living campuses, skilled nursing facilities and a hospital. As of December 31, 2021, we had investments of approximately $2.9 billion in 198 health care real estate properties located in 33 states and leased pursuant primarily to triple-net leases to 31 lessees consisting of 125 senior housing communities (“SHO”), 72 skilled nursing facilities and one hospital, excluding ten properties classified as assets held for sale. Our portfolio of 14 mortgages along with other notes receivable totaled $305.2 million, excluding an allowance for expected credit losses of $5.2 million, as of December 31, 2021. Units and beds disclosures in these consolidated financial statements are unaudited.
National Health Investors, Inc. (“NHI,” “the Company,” “we,” “us” or “our”), established in 1991 as a Maryland corporation, is a self-managed real estate investment trust (“REIT”) specializing in sale-leaseback, joint venture, mortgage and mezzanine financing of need-driven and discretionary senior housing and medical facility investments. Our portfolio consists of lease, mortgage and other note investments in independent living facilities, assisted living facilities, entrance-fee communities, senior living campuses, skilled nursing facilities and a hospital. As of December 31, 2021, we had investments of approximately $2.9 billion in 198 health care real estate properties located in 33 states and leased pursuant primarily to triple-net leases to 31 lessees consisting of 125 senior housing communities (“SHO”), 72 skilled nursing facilities and one hospital, excluding ten properties classified as assets held for sale. Our portfolio of 14 mortgages along with other notes receivable totaled $305.2 million, excluding an allowance for expected credit losses of $5.2 million, as of December 31, 2021. Units and beds disclosures in these consolidated financial statements are unaudited.
Free historical financial statements for National Health Investors Inc.. See how revenue, income, cash flow, and balance sheet financials have changed over 61 quarters since 2011. Compare with NHI stock chart to see long term trends.
Data imported from National Health Investors Inc. SEC filings. Check original filings before making any investment decision.