Industrials › Ball And Roller Bearings

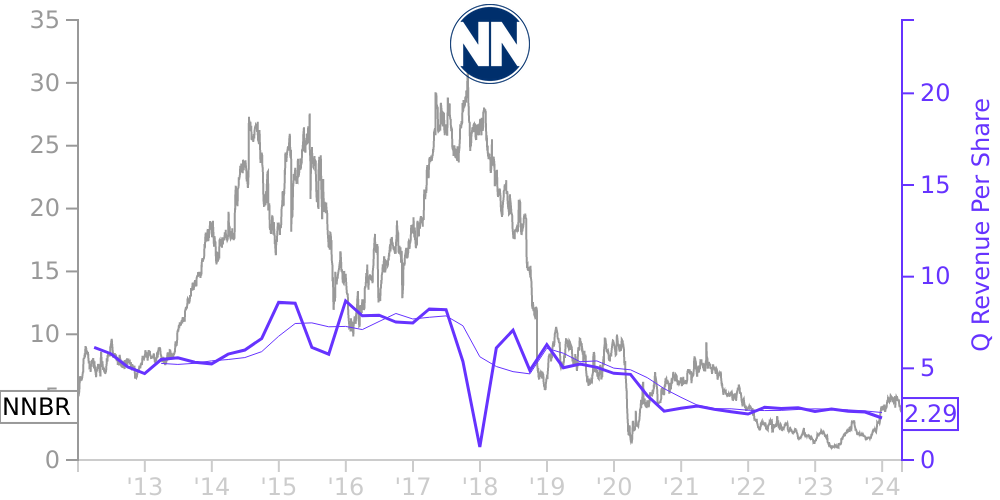
NNBR Stock Price Correlated With NN Financials
External Links ⌄
Income Statement
Cash Flow
Balance Sheet
NNBR Income Statement
Enable JavaScript and reload
Revenue, Net:
Cost of Goods & Services Sold:
Gross Profit:
Selling, General & Admin Expense:
Research & Development Expense:
Total Operating Expenses:
Operating Income:
Income Taxes:
Net Income:
NNBR Cash Flow
Enable JavaScript and reload
Operating Activities Net Income:
Depreciation, Depletion & Amortization:
Change in Accounts Receiveable:
Net Cash from Operations:
Repurchases/Buybacks Common Stock:
Issuance of Long-term Debt:
Cash Dividends Paid:
Net Cash from Financing Activities:
Property, Plant & Equipment Purchases:
Purchases of Businesses, Net of Cash:
Net Cash from Investing Activities:
Net Change in Cash & Equivalents:
NNBR Balance Sheet
Enable JavaScript and reload
Cash and Cash Equivalents:
Short-Term Investments:
Accounts Receivable, Net:
Inventories:
Total Current Assets:
Property, Plant & Equipment, Net:
Total Assets:
Accounts Payable:
Current Portion of Long-Term Debt:
Total Short-Term Liabilities:
Long Term Debt, Non-Current Portion:
Total Long-Term Liabilities:
Total Liabilities:
COMPANY PROFILE
Interim Financial Statements Nature of Business
NN, Inc. is a global diversified industrial company that combines advanced engineering and production capabilities with in-depth materials science expertise to design and manufacture high-precision components and assemblies primarily for the automotive, general industrial, electrical, aerospace, defense, and medical markets. As used in this Quarterly Report on Form 10-Q (this “Quarterly Report”), the terms “NN,” the “Company,” “we,” “our,” or “us” refer to NN, Inc., and its subsidiaries.
Basis of Presentation
The accompanying condensed consolidated financial statements have not been audited. The Condensed Consolidated Balance Sheet as of December 31, 2021, was derived from the audited consolidated financial statements included in our Annual Report on Form 10-K for the year ended December 31, 2021 (the “2021 Annual Report”), which we filed with the U.S. Securities and Exchange Commission (the “SEC”) on March 11, 2022. In management’s opinion, the accompanying unaudited condensed consolidated financial statements reflect all adjustments necessary to fairly state our results of operations for the three months ended March 31, 2022 and 2021; financial position as of March 31, 2022 and December 31, 2021; and cash flows for the three months ended March 31, 2022 and 2021, on a basis consistent with our audited consolidated financial statements. These adjustments are of a normal recurring nature and are, in the opinion of management, necessary to state fairly the Company’s financial position and operating results for the interim periods. Certain prior period amounts have been reclassified to conform to the current year’s presentation.
Certain information and footnote disclosures normally included in the consolidated financial statements prepared in accordance with accounting principles generally accepted in the United States (“U.S. GAAP”) have been condensed or omitted from the unaudited condensed consolidated financial statements presented in this Quarterly Report. These unaudited condensed consolidated financial statements should be read in conjunction with our audited consolidated financial statements and accompanying notes included in the 2021 Annual Report. The results for the three months ended March 31, 2022, are not necessarily indicative of results for the year ending December 31, 2022, or any other future periods.
Except for per share data or as otherwise indicated, all U.S. dollar amounts and share counts presented in the tables in these Notes to Condensed Consolidated Financial Statements are in thousands.
Accounting Standards Recently Adopted
In August 2020, the FASB issued ASU 2020-06, Accounting for Convertible Instruments and Contracts in an Entity’s Own Equity (“ASU 2020-06”), which simplifies the accounting for certain financial instruments with characteristics of liabilities and equity. Specifically, ASU 2020-06 simplifies accounting for convertible instruments by removing major separation models required under current U.S. GAAP. In addition, ASU 2020-06 removes certain settlement conditions that are required for equity contracts to qualify for the derivative scope exception, which will permit more equity contracts to qualify for the exception. Further, for the diluted earnings-per-share calculation, the new guidance requires entities to use the if-converted method for all convertible instruments and generally requires entities to include the effect of share settlement for instruments that may be settled in cash or shares, among other things. The adoption of ASU 2020-06 effective January 1, 2022 did not have a material impact on our consolidated financial statements and related disclosures.
In May 2021, the FASB issued ASU 2021-04, Issuer’s Accounting for Certain Modifications or Exchanges of Freestanding Equity-Classified Written Call Options (“ASU 2021-04”), which clarifies the accounting for modifications or exchanges of freestanding equity-classif
Free historical financial statements for NN Inc.. See how revenue, income, cash flow, and balance sheet financials have changed over 57 quarters since 2012. Compare with NNBR stock chart to see long term trends.
Data imported from NN Inc. SEC filings. Check original filings before making any investment decision.