Energy › Oil And Gas Filed Machinery And Equipment

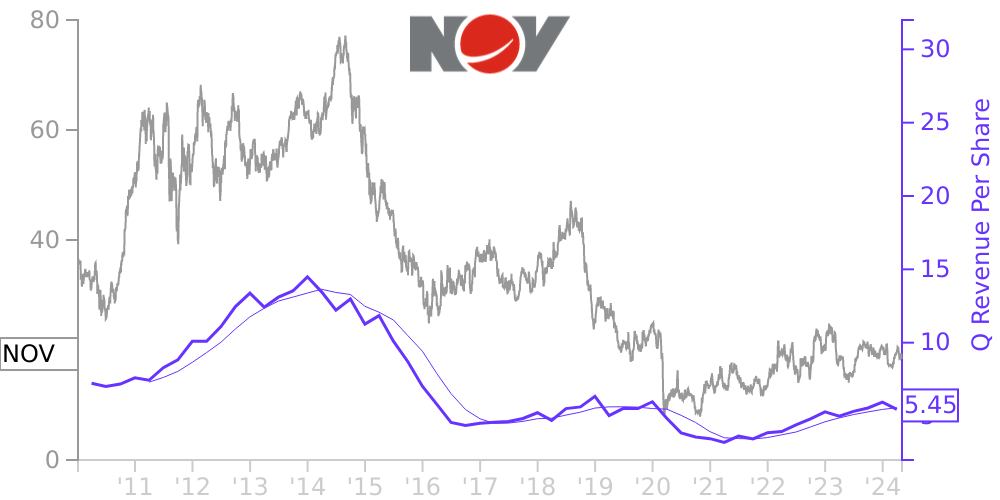
NOV Stock Price Correlated With NOV Financials
External Links ⌄
Income Statement
Cash Flow
Balance Sheet
NOV Income Statement
Enable JavaScript and reload
Revenue, Net:
Cost of Goods & Services Sold:
Gross Profit:
Selling, General & Admin Expense:
Research & Development Expense:
Total Operating Expenses:
Operating Income:
Income Taxes:
Net Income:
NOV Cash Flow
Enable JavaScript and reload
Operating Activities Net Income:
Depreciation, Depletion & Amortization:
Change in Accounts Receiveable:
Net Cash from Operations:
Repurchases/Buybacks Common Stock:
Issuance of Long-term Debt:
Cash Dividends Paid:
Net Cash from Financing Activities:
Property, Plant & Equipment Purchases:
Purchases of Businesses, Net of Cash:
Net Cash from Investing Activities:
Net Change in Cash & Equivalents:
NOV Balance Sheet
Enable JavaScript and reload
Cash and Cash Equivalents:
Short-Term Investments:
Accounts Receivable, Net:
Inventories:
Total Current Assets:
Property, Plant & Equipment, Net:
Total Assets:
Accounts Payable:
Current Portion of Long-Term Debt:
Total Short-Term Liabilities:
Long Term Debt, Non-Current Portion:
Total Long-Term Liabilities:
Total Liabilities:
COMPANY PROFILE
1. Organization and Basis of Presentation
Nature of Business
We design, construct, manufacture and sell comprehensive systems, components, and products used in oil and gas drilling and production and certain industrial and renewable energy sectors. We also provide technology and oilfield services and supplies, distribute products and provide supply chain integration services to the upstream oil and gas industry. Our revenues and operating results are directly related to the level of worldwide oil and gas drilling and production activities and the profitability and cash flow of oil and gas companies, drilling contractors and oilfield service companies, which in turn are affected by current and anticipated prices of oil and gas. Oil and gas prices have been, and are likely to continue to be, volatile.
Basis of Consolidation
The accompanying Consolidated Financial Statements include the accounts of NOV Inc. and its consolidated subsidiaries. Certain reclassifications have been made to the prior year financial statements for them to conform with the 2021 presentation. All significant intercompany transactions and balances have been eliminated in consolidation. Investments that are not wholly owned, but where we exercise control, are fully consolidated with the equity held by minority owners and their portion of net income (loss) reflected as noncontrolling interests in the accompanying consolidated financial statements. Investments in unconsolidated affiliates, over which we exercise significant influence, but not control, are accounted for by the equity method.
Free historical financial statements for NOV Inc.. See how revenue, income, cash flow, and balance sheet financials have changed over 65 quarters since 2010. Compare with NOV stock chart to see long term trends.
Data imported from NOV Inc. SEC filings. Check original filings before making any investment decision.