Industrials › Ordnance And Accessories, (No Vehicles/Guided Missiles)

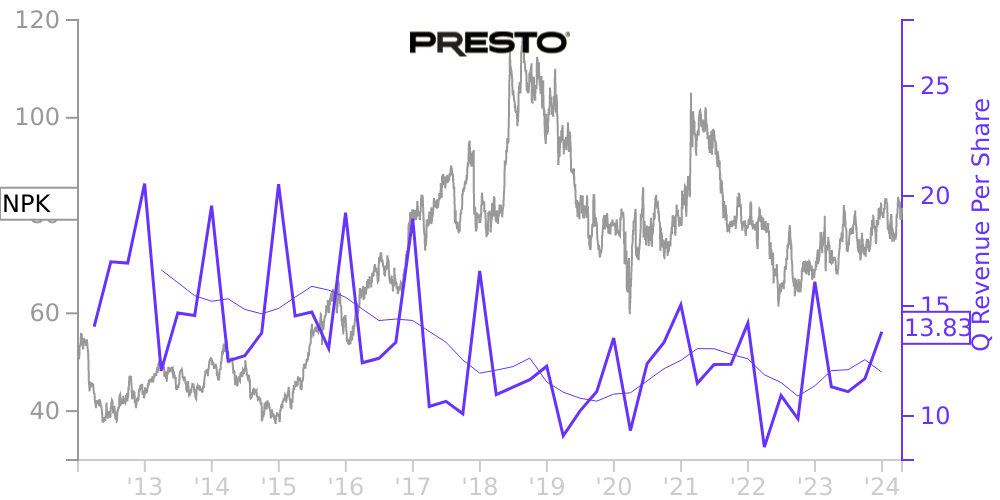
NPK Stock Price Correlated With National Presto Industries Financials
External Links ⌄
Income Statement
Cash Flow
Balance Sheet
NPK Income Statement
Enable JavaScript and reload
Revenue, Net:
Cost of Goods & Services Sold:
Gross Profit:
Selling, General & Admin Expense:
Research & Development Expense:
Total Operating Expenses:
Operating Income:
Income Taxes:
Net Income:
NPK Cash Flow
Enable JavaScript and reload
Operating Activities Net Income:
Depreciation, Depletion & Amortization:
Change in Accounts Receiveable:
Net Cash from Operations:
Repurchases/Buybacks Common Stock:
Issuance of Long-term Debt:
Cash Dividends Paid:
Net Cash from Financing Activities:
Property, Plant & Equipment Purchases:
Purchases of Businesses, Net of Cash:
Net Cash from Investing Activities:
Net Change in Cash & Equivalents:
NPK Balance Sheet
Enable JavaScript and reload
Cash and Cash Equivalents:
Short-Term Investments:
Accounts Receivable, Net:
Inventories:
Total Current Assets:
Property, Plant & Equipment, Net:
Total Assets:
Accounts Payable:
Current Portion of Long-Term Debt:
Total Short-Term Liabilities:
Long Term Debt, Non-Current Portion:
Total Long-Term Liabilities:
Total Liabilities:
COMPANY PROFILE
NOTE A – BASIS OF PRESENTATION
The consolidated interim financial statements included herein are unaudited and have been prepared by the Company pursuant to the rules and regulations of the United States Securities and Exchange Commission (“SEC”). In the opinion of management of the Company, the consolidated interim financial statements reflect all of the adjustments which were of a normal recurring nature necessary for a fair presentation of the results of the interim periods. The condensed consolidated balance sheet as of December 31, 2021 is summarized from audited consolidated financial statements, but does not include all the disclosures contained therein and should be read in conjunction with the 2021 Annual Report on Form 10 -K. Interim results for the period are not indicative of those for the year.
The consolidated interim financial statements included herein are unaudited and have been prepared by the Company pursuant to the rules and regulations of the United States Securities and Exchange Commission (“SEC”). In the opinion of management of the Company, the consolidated interim financial statements reflect all of the adjustments which were of a normal recurring nature necessary for a fair presentation of the results of the interim periods. The condensed consolidated balance sheet as of December 31, 2021 is summarized from audited consolidated financial statements, but does not include all the disclosures contained therein and should be read in conjunction with the 2021 Annual Report on Form 10 -K. Interim results for the period are not indicative of those for the year.
Free historical financial statements for National Presto Industries Inc. See how revenue, income, cash flow, and balance sheet financials have changed over 57 quarters since 2012. Compare with NPK stock chart to see long term trends.
Data imported from National Presto Industries Inc SEC filings. Check original filings before making any investment decision.