Industrials › Services-Help Supply Services

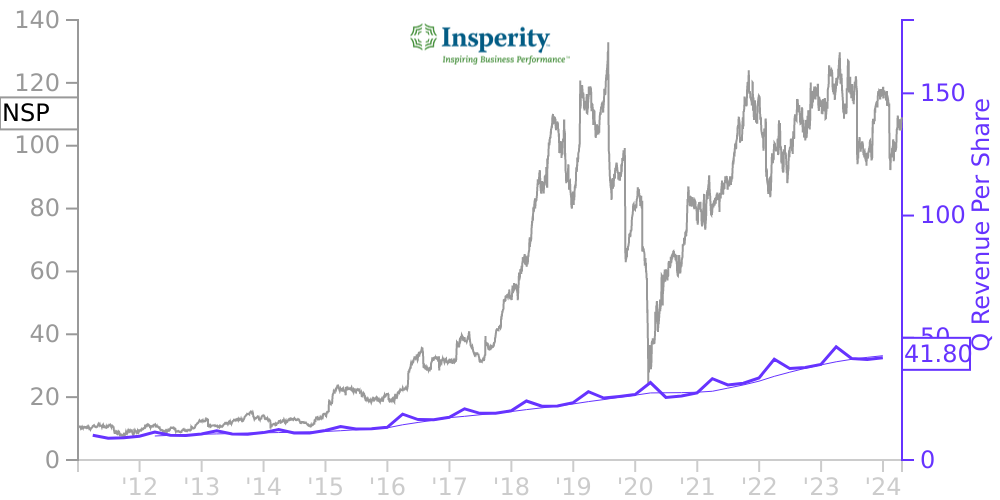
NSP Stock Price Correlated With Insperity Financials
External Links ⌄
Income Statement
Cash Flow
Balance Sheet
NSP Income Statement
Enable JavaScript and reload
Revenue, Net:
Cost of Goods & Services Sold:
Gross Profit:
Selling, General & Admin Expense:
Research & Development Expense:
Total Operating Expenses:
Operating Income:
Income Taxes:
Net Income:
NSP Cash Flow
Enable JavaScript and reload
Operating Activities Net Income:
Depreciation, Depletion & Amortization:
Change in Accounts Receiveable:
Net Cash from Operations:
Repurchases/Buybacks Common Stock:
Issuance of Long-term Debt:
Cash Dividends Paid:
Net Cash from Financing Activities:
Property, Plant & Equipment Purchases:
Purchases of Businesses, Net of Cash:
Net Cash from Investing Activities:
Net Change in Cash & Equivalents:
NSP Balance Sheet
Enable JavaScript and reload
Cash and Cash Equivalents:
Short-Term Investments:
Accounts Receivable, Net:
Inventories:
Total Current Assets:
Property, Plant & Equipment, Net:
Total Assets:
Accounts Payable:
Current Portion of Long-Term Debt:
Total Short-Term Liabilities:
Long Term Debt, Non-Current Portion:
Total Long-Term Liabilities:
Total Liabilities:
COMPANY PROFILE
1. Basis of Presentation
Insperity, Inc., a Delaware corporation (“Insperity,” “we,” “our,” and “us”), provides an array of human resources (“HR”) and business solutions designed to help improve business performance. Our most comprehensive HR services offerings are provided through our professional employer organization (“PEO”) services, known as Workforce Optimization ® and Workforce Synchronization TM solutions (together, our “PEO HR Outsourcing solutions”), which we provide by entering into a co-employment relationship with our clients. Our PEO HR Outsourcing solutions encompass a broad range of HR functions, including payroll and employment administration, employee benefits, workers’ compensation, government compliance, performance management, and training and development services, along with our cloud-based human capital management solution, the Insperity Premier TM platform.
In addition to our PEO HR Outsourcing solutions, we offer a comprehensive traditional payroll and human capital management solution, known as our Workforce Acceleration TM solution. We also offer a number of other business performance solutions, including Organizational Planning, Recruiting Services, Employment Screening, Retirement Services, and Insurance Services. These other products or services are offered separately or with our other solutions.
The Consolidated Financial Statements include the accounts of Insperity, Inc. and its wholly owned subsidiaries. Intercompany accounts and transactions have been eliminated in consolidation.
The preparation of financial statements in conformity with accounting principles generally accepted in the United States (“GAAP”) requires management to make estimates and assumptions that affect the amounts reported in the financial statements and accompanying notes. Actual results could differ from those estimates.
The accompanying Consolidated Financial Statements should be read in conjunction with our audited Consolidated Financial Statements at and for the year ended December 31, 2021. Our Condensed Consolidated Balance Sheet at December 31, 2021 has been derived from the audited financial statements at that date, but does not include all of the information or footnotes required by GAAP for complete financial statements. Our Condensed Consolidated Balance Sheet at June 30, 2022 and our Consolidated Statements of Operations for the three and six month periods ended June 30, 2022 and 2021, our Consolidated Statements of Cash Flows for the six month periods ended June 30, 2022 and 2021 and our Consolidated Statements of Stockholders’ Equity for the three and six month periods ended June 30, 2022 and 2021, have been prepared by us without audit. In the opinion of management, all adjustments necessary to present fairly the consolidated financial position, results of operations and cash flows have been made, and all such adjustments are of a normal recurring nature. Certain prior year amounts have been reclassified to conform to the 2022 presentation.
The results of operations for the interim periods are not necessarily indicative of the operating results for a full year or of future operations.
Free historical financial statements for Insperity Inc. See how revenue, income, cash flow, and balance sheet financials have changed over 61 quarters since 2011. Compare with NSP stock chart to see long term trends.
Data imported from Insperity Inc SEC filings. Check original filings before making any investment decision.