Technology › Computer Storage Devices

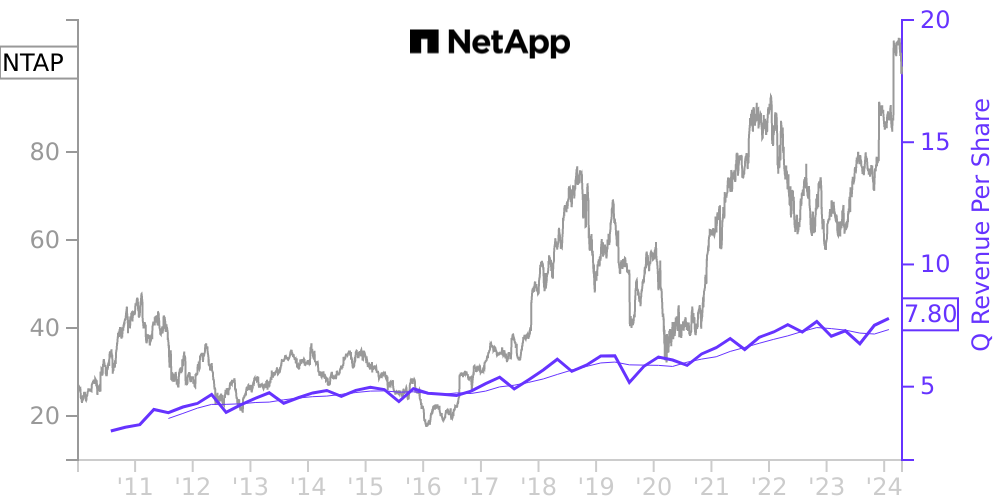
NTAP Stock Price Correlated With NetApp Financials
External Links ⌄
Income Statement
Cash Flow
Balance Sheet
NTAP Income Statement
Enable JavaScript and reload
Revenue, Net:
Cost of Goods & Services Sold:
Gross Profit:
Selling, General & Admin Expense:
Research & Development Expense:
Total Operating Expenses:
Operating Income:
Income Taxes:
Net Income:
NTAP Cash Flow
Enable JavaScript and reload
Operating Activities Net Income:
Depreciation, Depletion & Amortization:
Change in Accounts Receiveable:
Net Cash from Operations:
Repurchases/Buybacks Common Stock:
Issuance of Long-term Debt:
Cash Dividends Paid:
Net Cash from Financing Activities:
Property, Plant & Equipment Purchases:
Purchases of Businesses, Net of Cash:
Net Cash from Investing Activities:
Net Change in Cash & Equivalents:
NTAP Balance Sheet
Enable JavaScript and reload
Cash and Cash Equivalents:
Short-Term Investments:
Accounts Receivable, Net:
Inventories:
Total Current Assets:
Property, Plant & Equipment, Net:
Total Assets:
Accounts Payable:
Current Portion of Long-Term Debt:
Total Short-Term Liabilities:
Long Term Debt, Non-Current Portion:
Total Long-Term Liabilities:
Total Liabilities:
COMPANY PROFILE
1. Description of Business and Significant Accounting Policies
Description of Business — NetApp, Inc. (we, us, or the Company) is a global cloud-led, data-centric software company that provides organizations the ability to manage and share their data across on-premises, private and public clouds. We provide a full range of enterprise-class software, systems and services solutions that customers use to modernize their infrastructures, build next generation data centers and harness the power of hybrid clouds.
Fiscal Year — Our fiscal year is reported on a 52- or 53-week year ending on the last Friday in April. An additional week is included in the first fiscal quarter approximately every six years to realign fiscal months with calendar months. Fiscal year 2021, ending on April 30, 2021 is a 53-week year, with 14 weeks included in its first quarter and 13 weeks in each subsequent quarter. Fiscal year 2020, which ended on April 24, 2020, and fiscal year 2019, which ended on April 26, 2019 were both 52-week years. Unless otherwise stated, references to particular years, quarters, months and periods refer to the Company’s fiscal years ended on the last Friday of April and the associated quarters, months and periods of those fiscal years .
Principles of Consolidation — The consolidated financial statements include the Company and its subsidiaries. Intercompany accounts and transactions are eliminated in consolidation.
Accounting Changes
In June 2016, the FASB issued an accounting standards update on the measurement of credit losses on financial instruments. The standard introduces a new model for measuring and recognizing credit losses on financial instruments, requiring financial assets measured at amortized cost basis to be presented at the net amount expected to be collected. It also requires that credit losses be recorded through an allowance for credit losses. On April 25, 2020, we adopted the standard with no material impact to our consolidated financial statements.
Use of Estimates — The preparation of the consolidated financial statements in conformity with accounting principles generally accepted in the United States of America (GAAP) requires management to make estimates and assumptions that affect the reported amounts of assets and liabilities and disclosure of contingent assets and liabilities at the date of the financial statements and the reported amounts of revenues and expenses during the reporting periods. Such estimates include, but are not limited to, revenue recognition, reserves and allowances; inventory valuation; valuation of goodwill and intangibles; restructuring reserves; employee benefit accruals; stock-based compensation; loss contingencies; investment impairments; income taxes and fair value measurements. Actual results could differ materially from those estimates, including impacts from the COVID-19 pandemic, the anticipated effects of which have been incorporated, as applicable, into management’s estimates as of and for the year ended April 30, 2021.
Cash Equivalents — We consider all highly liquid debt investments with original maturities of three months or less at the time of purchase to be cash equivalents.
Available-for-Sale Investments — We classify our investments in debt securities as available-for-sale investments. Debt securities primarily consist of corporate bonds, U.S. Treasury and government debt securities and certificates of deposit. These investments are primarily held in the custody of a major financial institution. A specific identification method is used to determine the cost basis of debt securities sold. These investments are recorded in the consolidated balance sheets at fair value.
Unrealized gains and temporary losses, net of related taxes, are included in accumulated other comprehensive income (loss) (AOCI). Upon realization, those amounts are reclassified from AOCI to earnings. The amortization of premiums and discounts on the investments are included in our results of operatio
Free historical financial statements for NetApp Inc. See how revenue, income, cash flow, and balance sheet financials have changed over 64 quarters since 2010. Compare with NTAP stock chart to see long term trends.
Data imported from NetApp Inc SEC filings. Check original filings before making any investment decision.