
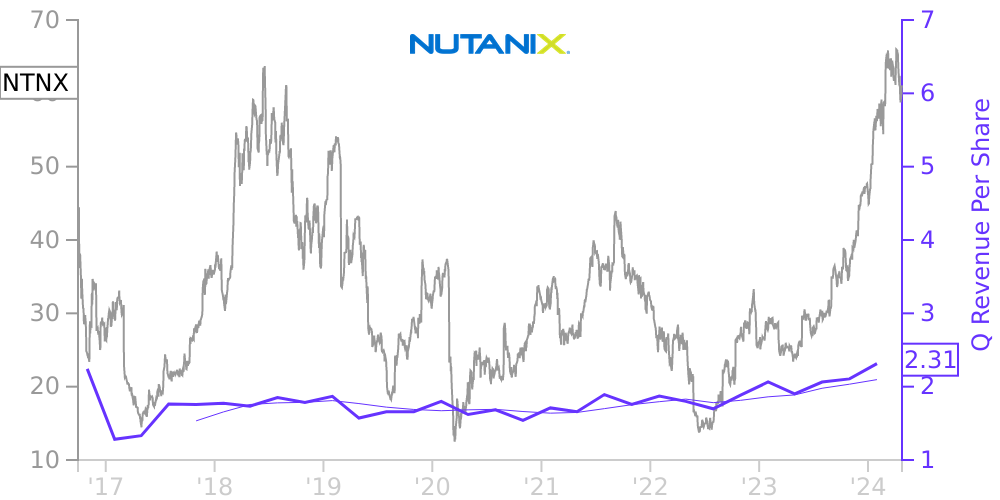
NTNX Stock Price Correlated With Nutanix Financials
External Links ⌄
Income Statement
Cash Flow
Balance Sheet
NTNX Income Statement
Enable JavaScript and reload
Revenue, Net:
Cost of Goods & Services Sold:
Gross Profit:
Selling, General & Admin Expense:
Research & Development Expense:
Total Operating Expenses:
Operating Income:
Income Taxes:
Net Income:
NTNX Cash Flow
Enable JavaScript and reload
Operating Activities Net Income:
Depreciation, Depletion & Amortization:
Change in Accounts Receiveable:
Net Cash from Operations:
Repurchases/Buybacks Common Stock:
Issuance of Long-term Debt:
Cash Dividends Paid:
Net Cash from Financing Activities:
Property, Plant & Equipment Purchases:
Purchases of Businesses, Net of Cash:
Net Cash from Investing Activities:
Net Change in Cash & Equivalents:
NTNX Balance Sheet
Enable JavaScript and reload
Cash and Cash Equivalents:
Short-Term Investments:
Accounts Receivable, Net:
Inventories:
Total Current Assets:
Property, Plant & Equipment, Net:
Total Assets:
Accounts Payable:
Current Portion of Long-Term Debt:
Total Short-Term Liabilities:
Long Term Debt, Non-Current Portion:
Total Long-Term Liabilities:
Total Liabilities:
COMPANY PROFILE
Organization and Description of Business —Nutanix, Inc. was incorporated in the state of Delaware in September 2009. Nutanix, Inc. is headquartered in San Jose, California, and together with its wholly-owned subsidiaries (collectively, the “Company”) has operations throughout North America, Europe, Asia-Pacific, Middle East, Latin America and Africa.
The Company’s enterprise cloud operating system converges traditional silos of server, virtualization, storage and networking into one integrated solution and unifies private and public cloud into a single software fabric. The Company primarily sells its products and services to end-customers through distributors, resellers and original equipment manufacturers (collectively “Partners”).
During the first quarter of fiscal 2017, the Company completed two acquisitions, Calm.io Pte. Ltd. (“Calm”) and PernixData, Inc. (“PernixData”) (see Note 3).
Initial Public Offering —In October 2016, the Company completed its initial public offering (“IPO”) of Class A common stock, in which it sold 17,100,500 shares, including 2,230,500 shares pursuant to the underwriters’ over-allotment option. The shares were sold at an IPO price of $16.00 per share for net proceeds of $254.5 million , after deducting underwriting discounts and commissions of $19.2 million . Additionally, offering costs incurred by the Company totaled $5.3 million . Immediately prior to the closing of the Company’s IPO, all outstanding shares of common stock were reclassified as Class B common stock, and all outstanding shares of its convertible preferred stock automatically converted into 76,319,511 shares of common stock on a one -to-one basis and then reclassified as shares of Class B common stock. Following the IPO, the Company has two classes of authorized common stock, Class A common stock, which entitles holders to one vote per share, and Class B common stock which entitles holders to 10 votes per share.
Free historical financial statements for Nutanix Inc. See how revenue, income, cash flow, and balance sheet financials have changed over 39 quarters since 2016. Compare with NTNX stock chart to see long term trends.
Data imported from Nutanix Inc SEC filings. Check original filings before making any investment decision.