Materials › Steel Works, Blast Furnaces Rolling Mills (Coke Ovens)

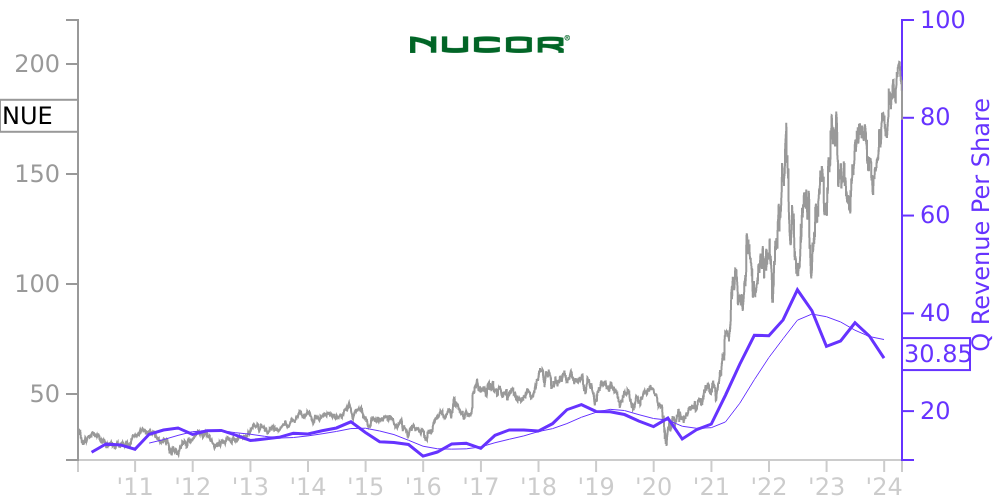
NUE Stock Price Correlated With Nucor Financials
External Links ⌄
Income Statement
Cash Flow
Balance Sheet
NUE Income Statement
Enable JavaScript and reload
Revenue, Net:
Cost of Goods & Services Sold:
Gross Profit:
Selling, General & Admin Expense:
Research & Development Expense:
Total Operating Expenses:
Operating Income:
Income Taxes:
Net Income:
NUE Cash Flow
Enable JavaScript and reload
Operating Activities Net Income:
Depreciation, Depletion & Amortization:
Change in Accounts Receiveable:
Net Cash from Operations:
Repurchases/Buybacks Common Stock:
Issuance of Long-term Debt:
Cash Dividends Paid:
Net Cash from Financing Activities:
Property, Plant & Equipment Purchases:
Purchases of Businesses, Net of Cash:
Net Cash from Investing Activities:
Net Change in Cash & Equivalents:
NUE Balance Sheet
Enable JavaScript and reload
Cash and Cash Equivalents:
Short-Term Investments:
Accounts Receivable, Net:
Inventories:
Total Current Assets:
Property, Plant & Equipment, Net:
Total Assets:
Accounts Payable:
Current Portion of Long-Term Debt:
Total Short-Term Liabilities:
Long Term Debt, Non-Current Portion:
Total Long-Term Liabilities:
Total Liabilities:
COMPANY PROFILE
1. Nature of Operations and Basis of Presentation
Nature of Operations
Nucor is principally a manufacturer of steel and steel products, as well as a scrap broker and processor, with operating facilities and customers primarily located in North America.
Principles of Consolidation
The consolidated financial statements include Nucor and its controlled subsidiaries, including Nucor-Yamato Steel Company (Limited Partnership) (“Nucor-Yamato”), of which Nucor owns 51%. All intercompany transactions are eliminated.
Distributions are made to noncontrolling interest partners in Nucor-Yamato Steel Company (Limited Partnership) in accordance with the limited partnership agreement by mutual agreement of the general partners. At a minimum, sufficient cash is distributed so that each partner may pay its U.S. federal and state income taxes.
Use of Estimates
The preparation of financial statements in conformity with generally accepted accounting principles in the United States of America requires management to make estimates and assumptions that affect the amounts reported in the financial statements and accompanying notes. Actual results could differ from these estimates.
Free historical financial statements for Nucor Corp. See how revenue, income, cash flow, and balance sheet financials have changed over 65 quarters since 2010. Compare with NUE stock chart to see long term trends.
Data imported from Nucor Corp SEC filings. Check original filings before making any investment decision.