
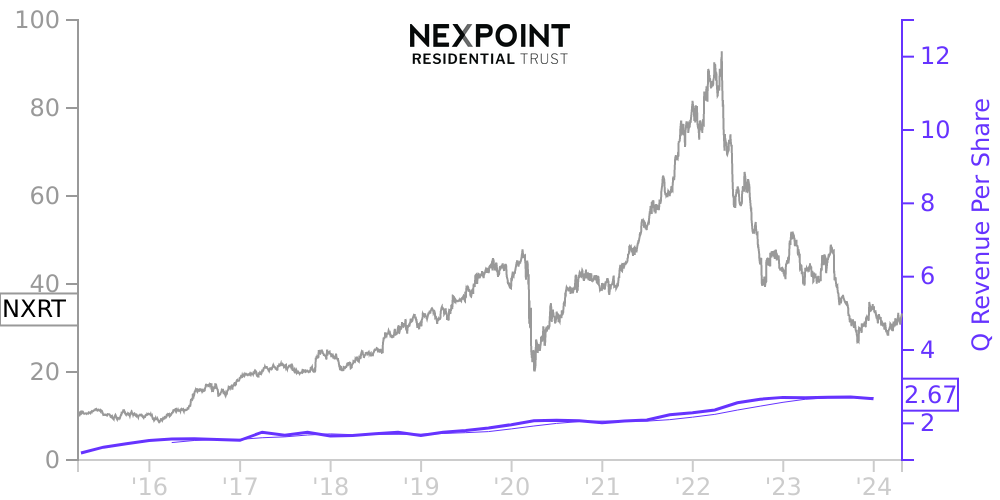
NXRT Stock Price Correlated With NexPoint Residential Trust Financials
External Links ⌄
Income Statement
Cash Flow
Balance Sheet
NXRT Income Statement
Enable JavaScript and reload
Revenue, Net:
Cost of Goods & Services Sold:
Gross Profit:
Selling, General & Admin Expense:
Research & Development Expense:
Total Operating Expenses:
Operating Income:
Income Taxes:
Net Income:
NXRT Cash Flow
Enable JavaScript and reload
Operating Activities Net Income:
Depreciation, Depletion & Amortization:
Change in Accounts Receiveable:
Net Cash from Operations:
Repurchases/Buybacks Common Stock:
Issuance of Long-term Debt:
Cash Dividends Paid:
Net Cash from Financing Activities:
Property, Plant & Equipment Purchases:
Purchases of Businesses, Net of Cash:
Net Cash from Investing Activities:
Net Change in Cash & Equivalents:
NXRT Balance Sheet
Enable JavaScript and reload
Cash and Cash Equivalents:
Short-Term Investments:
Accounts Receivable, Net:
Inventories:
Total Current Assets:
Property, Plant & Equipment, Net:
Total Assets:
Accounts Payable:
Current Portion of Long-Term Debt:
Total Short-Term Liabilities:
Long Term Debt, Non-Current Portion:
Total Long-Term Liabilities:
Total Liabilities:
COMPANY PROFILE
NexPoint Residential Trust, Inc. (the “Company”, “we”, “our”) was incorporated in Maryland on September 19, 2014, and has elected to be taxed as a real estate investment trust (“REIT”). The Company is focused on “value-add” multifamily investments primarily located in the Southeastern and Southwestern United States. Substantially all of the Company’s business is conducted through NexPoint Residential Trust Operating Partnership, L.P. (the “OP”), the Company’s operating partnership. The Company owns its properties (the “Portfolio”) through the OP and its wholly owned taxable REIT subsidiary (“TRS”). The OP owns approximately 99.9% of the Portfolio; the TRS owns approximately 0.1% of the Portfolio. The Company’s wholly owned subsidiary, NexPoint Residential Trust Operating Partnership GP, LLC (the “OP GP”), is the sole general partner of the OP. As of December 31, 2021, there were 23,819,402 common units in the OP (“OP Units”) outstanding, of which 23,746,169, or 99.7%, were owned by the Company and 73,233, or 0.3%, were owned by a noncontrolling limited partner (see Note 10).
The Company is externally managed by NexPoint Real Estate Advisors, L.P. (the “Adviser”), through an agreement dated March 16, 2015, as amended, and renewed on February 14, 2022 for a one-year term (the “Advisory Agreement”), by and among the Company, the OP and the Adviser. The Adviser conducts substantially all of the Company’s operations and provides asset management services for its real estate investments. The Company expects it will only have accounting employees while the Advisory Agreement is in effect. All of the Company’s investment decisions are made by the Adviser, subject to general oversight by the Adviser’s investment committee and the Company’s board of directors (the “Board”). The Adviser is wholly owned by NexPoint Advisors, L.P. (the “Sponsor”).
The Company’s investment objectives are to maximize the cash flow and value of properties owned, acquire properties with cash flow growth potential, provide quarterly cash distributions and achieve long-term capital appreciation for its stockholders through targeted management and a value-add program. Consistent with the Company’s policy to acquire assets for both income and capital gain, the Company intends to hold at least majority interests in its properties for long-term appreciation and to engage in the business of directly or indirectly acquiring, owning, and operating well-located multifamily properties with a value-add component in large cities and suburban submarkets of large cities primarily in the Southeastern and Southwestern United States consistent with its investment objectives. Economic and market conditions may influence the Company to hold properties for different periods of time. From time to time, the Company may sell a property if, among other deciding factors, the sale would be in the best interest of its stockholders.
The Company may allocate up to 30% of the portfolio to investments in real estate-related debt and securities with the potential for high current income or total returns. These allocations may include first and second mortgages and subordinated, bridge, mezzanine, construction and other loans, as well as debt securities related to or secured by multifamily real estate and common and preferred equity securities, which may include securities of other REITs or real estate companies.
Free historical financial statements for NexPoint Residential Trust Inc.. See how revenue, income, cash flow, and balance sheet financials have changed over 45 quarters since 2015. Compare with NXRT stock chart to see long term trends.
Data imported from NexPoint Residential Trust Inc. SEC filings. Check original filings before making any investment decision.