
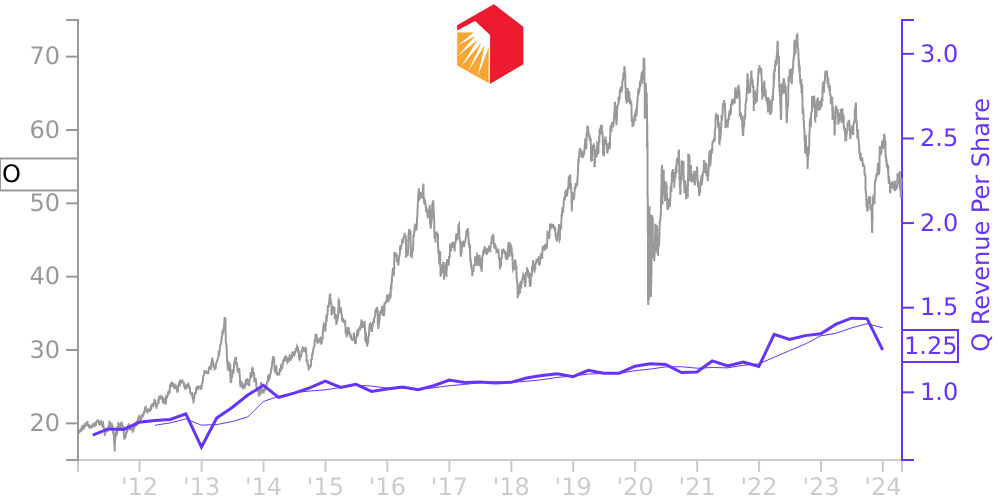
O Stock Price Correlated With Realty Income Financials
External Links ⌄
Income Statement
Cash Flow
Balance Sheet
O Income Statement
Enable JavaScript and reload
Revenue, Net:
Cost of Goods & Services Sold:
Gross Profit:
Selling, General & Admin Expense:
Research & Development Expense:
Total Operating Expenses:
Operating Income:
Income Taxes:
Net Income:
O Cash Flow
Enable JavaScript and reload
Operating Activities Net Income:
Depreciation, Depletion & Amortization:
Change in Accounts Receiveable:
Net Cash from Operations:
Repurchases/Buybacks Common Stock:
Issuance of Long-term Debt:
Cash Dividends Paid:
Net Cash from Financing Activities:
Property, Plant & Equipment Purchases:
Purchases of Businesses, Net of Cash:
Net Cash from Investing Activities:
Net Change in Cash & Equivalents:
O Balance Sheet
Enable JavaScript and reload
Cash and Cash Equivalents:
Short-Term Investments:
Accounts Receivable, Net:
Inventories:
Total Current Assets:
Property, Plant & Equipment, Net:
Total Assets:
Accounts Payable:
Current Portion of Long-Term Debt:
Total Short-Term Liabilities:
Long Term Debt, Non-Current Portion:
Total Long-Term Liabilities:
Total Liabilities:
COMPANY PROFILE
Organization and Operation Realty Income Corporation (“Realty Income,” the “Company,” “we,” “our” or “us”) was founded in 1969 and is organized as a Maryland corporation. We invest in commercial real estate and have elected to be taxed as a real estate investment trust ("REIT"). We are listed on the New York Stock Exchange under the symbol “O”.
Over the past 53 years, we have been acquiring and managing freestanding commercial properties that generate rental revenue under long-term net lease agreements with our commercial clients. At December 31, 2021, we owned 11,136 properties, located in all 50 United States (U.S.) states, Puerto Rico, the United Kingdom (U.K.) and Spain, containing approximately 210.1 million leasable square feet.
Information with respect to number of properties, leasable square feet, average initial lease term and initial weighted average cash lease yield is unaudited. Unless otherwise indicated, all dollar amounts are expressed in U.S. dollars.
In November 2021, we completed our merger with VEREIT, Inc. (VEREIT). For more details, please see note 3, Merger with VEREIT, Inc. and Orion Office REIT Inc. Divestiture.
Free historical financial statements for Realty Income Corp.. See how revenue, income, cash flow, and balance sheet financials have changed over 61 quarters since 2011. Compare with O stock chart to see long term trends.
Data imported from Realty Income Corp. SEC filings. Check original filings before making any investment decision.