
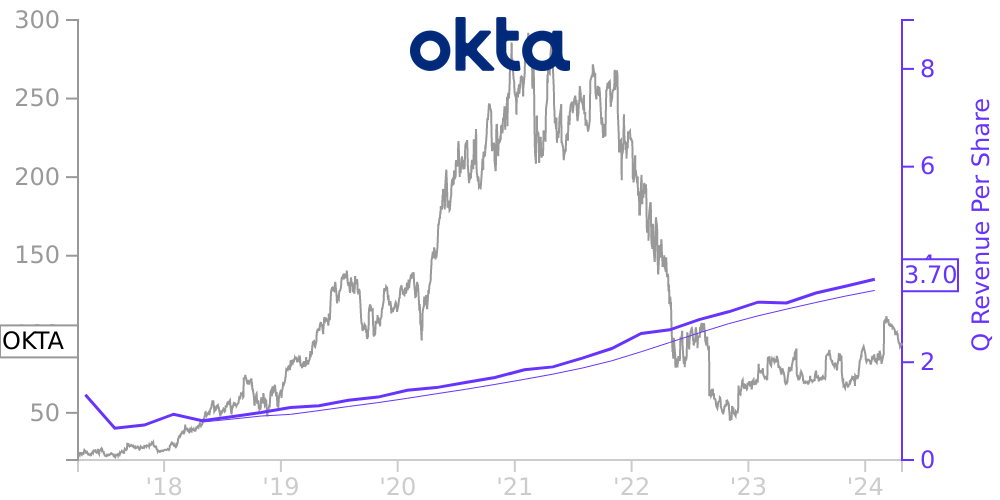
OKTA Stock Price Correlated With Okta Financials
External Links ⌄
Income Statement
Cash Flow
Balance Sheet
OKTA Income Statement
Enable JavaScript and reload
Revenue, Net:
Cost of Goods & Services Sold:
Gross Profit:
Selling, General & Admin Expense:
Research & Development Expense:
Total Operating Expenses:
Operating Income:
Income Taxes:
Net Income:
OKTA Cash Flow
Enable JavaScript and reload
Operating Activities Net Income:
Depreciation, Depletion & Amortization:
Change in Accounts Receiveable:
Net Cash from Operations:
Repurchases/Buybacks Common Stock:
Issuance of Long-term Debt:
Cash Dividends Paid:
Net Cash from Financing Activities:
Property, Plant & Equipment Purchases:
Purchases of Businesses, Net of Cash:
Net Cash from Investing Activities:
Net Change in Cash & Equivalents:
OKTA Balance Sheet
Enable JavaScript and reload
Cash and Cash Equivalents:
Short-Term Investments:
Accounts Receivable, Net:
Inventories:
Total Current Assets:
Property, Plant & Equipment, Net:
Total Assets:
Accounts Payable:
Current Portion of Long-Term Debt:
Total Short-Term Liabilities:
Long Term Debt, Non-Current Portion:
Total Long-Term Liabilities:
Total Liabilities:
COMPANY PROFILE
Overview and Basis of Presentation Description of Business
Okta, Inc. (the “Company”) is the leading independent identity provider. The Okta Identity Cloud enables the Company’s customers to securely connect the right people to the right technologies and services at the right time. The Company was incorporated in January 2009 as Saasure Inc., a California corporation, and was later reincorporated in April 2010 under the name Okta, Inc. as a Delaware corporation. The Company is headquartered in San Francisco, California.
Basis of Presentation and Principles of Consolidation
The accompanying consolidated financial statements, which include the accounts of the Company and its wholly owned subsidiaries, have been prepared in conformity with accounting principles generally accepted in the United States of America ("GAAP"). All intercompany balances and transactions have been eliminated in consolidation.
The consolidated financial statements include the results of operations for acquired businesses from their acquisition dates to January 31, 2022. See Note 3 for additional details.
The Company’s fiscal year ends on January 31. References to fiscal 2022, for example, refer to the fiscal year ended January 31, 2022.
Certain reclassifications of components of prior period operating cash flows have been made in the consolidated statements of cash flows to conform to the current period presentation. These reclassifications had no impact on total operating cash flows as previously reported.
Use of Estimates
The preparation of consolidated financial statements in conformity with GAAP requires management to make estimates, judgments and assumptions that affect the reported amounts of assets and liabilities, disclosure of contingent assets and liabilities at the date of the consolidated financial statements and the reported amounts of revenue and expenses during the reporting period. The Company bases its estimates on historical experience and on other assumptions that its management believes are reasonable under the circumstances. Actual results could vary from those estimates. The Company’s most significant estimates include the SSP for each distinct performance obligation included in customer contracts with multiple performance obligations, the determination of the period of benefit for deferred commissions, the determination of the effective interest rate of the liability components of its convertible senior notes, the determination of the incremental borrowing rate used for operating lease liabilities, the valuation of deferred income tax assets, the valuation of goodwill and acquired intangible assets, including their useful lives and the valuation of certain equity awards assumed.
In March 2020, the World Health Organization declared the outbreak of COVID-19 a pandemic, which has spread across the globe. The Company considered the impact of COVID-19 on the assumptions and estimates used and determined that there were no material adverse impacts on the consolidated financial statements for the years ended January 31, 2022 and 2021. As events continue to evolve and additional information becomes available, the Company’s assumptions and estimates may change materially in future periods.
Foreign Currency
The functional currencies of the Company’s foreign subsidiaries are the respective local currencies. Translation adjustments arising from the use of differing exchange rates from period to period are included in accumulated other comprehensive loss within the consolidated statements of redeemable convertible preferred stock and stockholders’ equity (deficit). Foreign currency transaction gains and losses are included in other expense, net in the consolidated statements of operations and were not material for the years ended January 31, 2022, 2021 or 2020. All assets and liabilities denominated in a foreign currency are translated into U.S. dollars at the exchange rate on the balance sheet date. Revenue and expenses are translat
Free historical financial statements for Okta Inc. See how revenue, income, cash flow, and balance sheet financials have changed over 37 quarters since 2017. Compare with OKTA stock chart to see long term trends.
Data imported from Okta Inc SEC filings. Check original filings before making any investment decision.