Materials › Chemicals And Allied Products

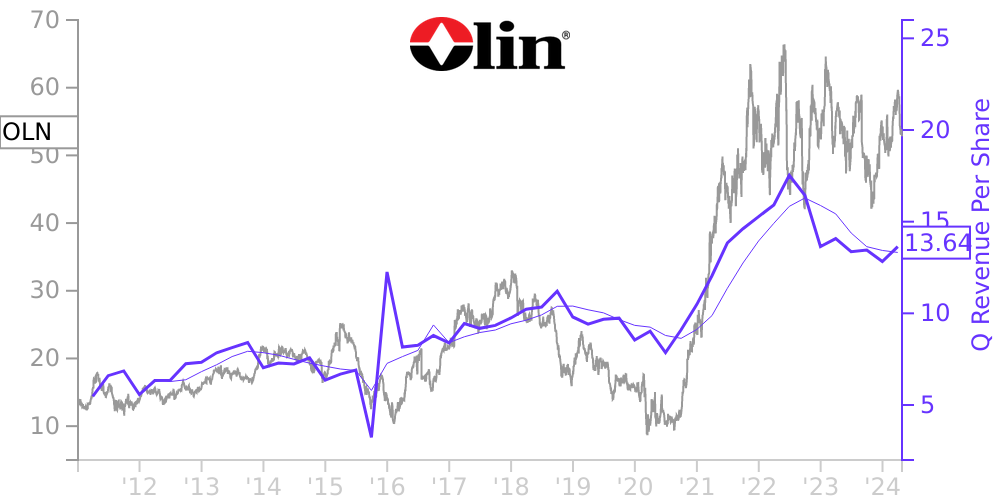
OLN Stock Price Correlated With Olin Financials
External Links ⌄
Income Statement
Cash Flow
Balance Sheet
OLN Income Statement
Enable JavaScript and reload
Revenue, Net:
Cost of Goods & Services Sold:
Gross Profit:
Selling, General & Admin Expense:
Research & Development Expense:
Total Operating Expenses:
Operating Income:
Income Taxes:
Net Income:
OLN Cash Flow
Enable JavaScript and reload
Operating Activities Net Income:
Depreciation, Depletion & Amortization:
Change in Accounts Receiveable:
Net Cash from Operations:
Repurchases/Buybacks Common Stock:
Issuance of Long-term Debt:
Cash Dividends Paid:
Net Cash from Financing Activities:
Property, Plant & Equipment Purchases:
Purchases of Businesses, Net of Cash:
Net Cash from Investing Activities:
Net Change in Cash & Equivalents:
OLN Balance Sheet
Enable JavaScript and reload
Cash and Cash Equivalents:
Short-Term Investments:
Accounts Receivable, Net:
Inventories:
Total Current Assets:
Property, Plant & Equipment, Net:
Total Assets:
Accounts Payable:
Current Portion of Long-Term Debt:
Total Short-Term Liabilities:
Long Term Debt, Non-Current Portion:
Total Long-Term Liabilities:
Total Liabilities:
COMPANY PROFILE
NOTE 1. DESCRIPTION OF BUSINESSOlin Corporation (Olin) is a Virginia corporation, incorporated in 1892, having its principal executive offices in Clayton, MO. We are a leading vertically-integrated global manufacturer and distributor of chemical products and a leading U.S. manufacturer of ammunition. Our operations are concentrated in three business segments: Chlor Alkali Products and Vinyls, Epoxy and Winchester. All of our business segments are capital intensive manufacturing businesses. The Chlor Alkali Products and Vinyls segment manufactures and sells chlorine and caustic soda, ethylene dichloride and vinyl chloride monomer, methyl chloride, methylene chloride, chloroform, carbon tetrachloride, perchloroethylene, hydrochloric acid, hydrogen, bleach products and potassium hydroxide. The Epoxy segment produces and sells a full range of epoxy materials and precursors, including aromatics (acetone, bisphenol, cumene and phenol), allyl chloride, epichlorohydrin, liquid epoxy resins, solid epoxy resins and downstream products such as converted epoxy resins and additives. The Winchester segment produces and sells sporting ammunition, reloading components, small caliber military ammunition and components, and industrial cartridges.
Free historical financial statements for Olin Corp. See how revenue, income, cash flow, and balance sheet financials have changed over 61 quarters since 2011. Compare with OLN stock chart to see long term trends.
Data imported from Olin Corp SEC filings. Check original filings before making any investment decision.