Technology › Semiconductors And Related Devices

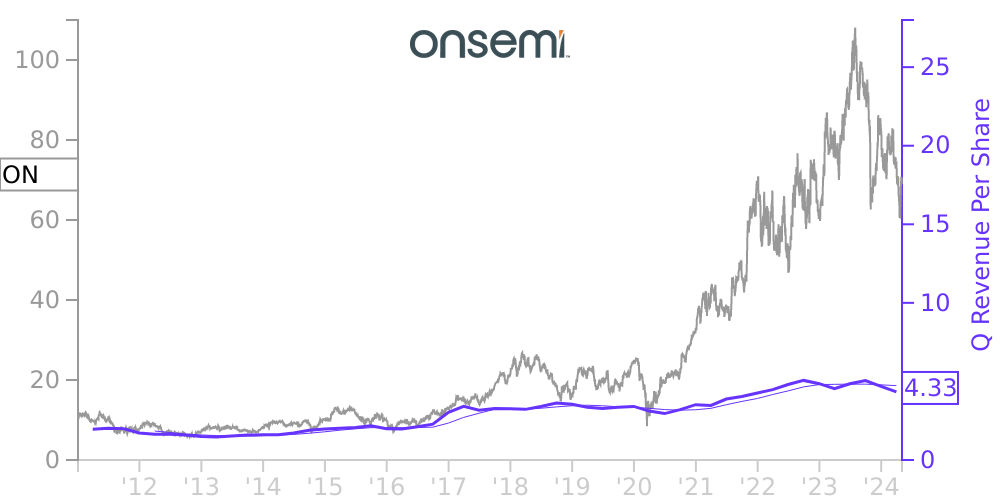
ON Stock Price Correlated With ON Semiconductor Financials
External Links ⌄
Income Statement
Cash Flow
Balance Sheet
ON Income Statement
Enable JavaScript and reload
Revenue, Net:
Cost of Goods & Services Sold:
Gross Profit:
Selling, General & Admin Expense:
Research & Development Expense:
Total Operating Expenses:
Operating Income:
Income Taxes:
Net Income:
ON Cash Flow
Enable JavaScript and reload
Operating Activities Net Income:
Depreciation, Depletion & Amortization:
Change in Accounts Receiveable:
Net Cash from Operations:
Repurchases/Buybacks Common Stock:
Issuance of Long-term Debt:
Cash Dividends Paid:
Net Cash from Financing Activities:
Property, Plant & Equipment Purchases:
Purchases of Businesses, Net of Cash:
Net Cash from Investing Activities:
Net Change in Cash & Equivalents:
ON Balance Sheet
Enable JavaScript and reload
Cash and Cash Equivalents:
Short-Term Investments:
Accounts Receivable, Net:
Inventories:
Total Current Assets:
Property, Plant & Equipment, Net:
Total Assets:
Accounts Payable:
Current Portion of Long-Term Debt:
Total Short-Term Liabilities:
Long Term Debt, Non-Current Portion:
Total Long-Term Liabilities:
Total Liabilities:
COMPANY PROFILE
Note 1: Background and Basis of Presentation
ON Semiconductor Corporation, together with its wholly and majority-owned subsidiaries (the "Company"), prepares its consolidated financial statements in accordance with GAAP. As of December 31, 2021, the Company was organized into three operating segments, which also represent its three reportable segments: PSG, ASG and ISG.
Unless otherwise noted, all dollar amounts are in millions, except per share amounts. Certain reclassifications have been made to prior period amounts to conform to current-period presentation.
Free historical financial statements for ON Semiconductor Corp.. See how revenue, income, cash flow, and balance sheet financials have changed over 61 quarters since 2011. Compare with ON stock chart to see long term trends.
Data imported from ON Semiconductor Corp. SEC filings. Check original filings before making any investment decision.