
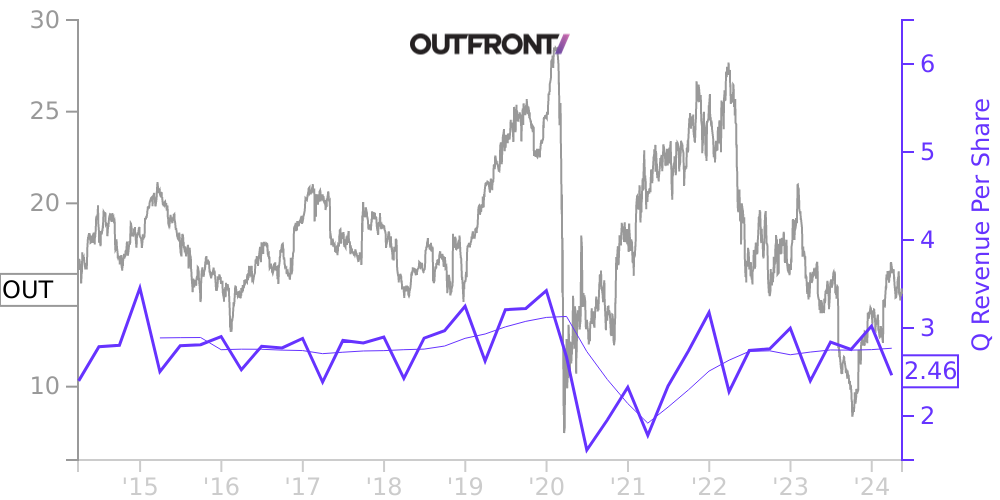
OUT Stock Price Correlated With Outfront Media Financials
External Links ⌄
Income Statement
Cash Flow
Balance Sheet
OUT Income Statement
Enable JavaScript and reload
Revenue, Net:
Cost of Goods & Services Sold:
Gross Profit:
Selling, General & Admin Expense:
Research & Development Expense:
Total Operating Expenses:
Operating Income:
Income Taxes:
Net Income:
OUT Cash Flow
Enable JavaScript and reload
Operating Activities Net Income:
Depreciation, Depletion & Amortization:
Change in Accounts Receiveable:
Net Cash from Operations:
Repurchases/Buybacks Common Stock:
Issuance of Long-term Debt:
Cash Dividends Paid:
Net Cash from Financing Activities:
Property, Plant & Equipment Purchases:
Purchases of Businesses, Net of Cash:
Net Cash from Investing Activities:
Net Change in Cash & Equivalents:
OUT Balance Sheet
Enable JavaScript and reload
Cash and Cash Equivalents:
Short-Term Investments:
Accounts Receivable, Net:
Inventories:
Total Current Assets:
Property, Plant & Equipment, Net:
Total Assets:
Accounts Payable:
Current Portion of Long-Term Debt:
Total Short-Term Liabilities:
Long Term Debt, Non-Current Portion:
Total Long-Term Liabilities:
Total Liabilities:
COMPANY PROFILE
Description of Business and Basis of Presentation Description of Business
OUTFRONT Media Inc. (the “Company”) and its subsidiaries (collectively, “we,” “us” or “our”) is a real estate investment trust (“REIT”), which provides advertising space (“displays”) on out-of-home advertising structures and sites in the United States (the “U.S.”) and Canada. Our inventory consists of billboard displays, which are primarily located on the most heavily traveled highways and roadways in top Nielsen Designated Market Areas (“DMAs”), and transit advertising displays operated under exclusive multi-year contracts with municipalities in large cities across the U.S. and Canada. In total, we have displays in all of the 25 largest markets in the U.S. and approximately 150 markets across the U.S. and Canada. We currently manage our operations through two operating segments—U.S. Billboard and Transit, which is included in our U.S. Media reportable segment, and International.
In the third quarter of 2020, we sold all of our equity interests in certain of our subsidiaries (the “Sports Disposition”), which held all of the assets of our Sports Marketing operating segment, for a purchase price of approximately $34.6 million in cash, subject to closing and post-closing adjustments (see Note 14. Acquisitions and Dispositions : Dispositions to the Consolidated Financial Statements). The Sports Marketing operating segment was the marketing and multimedia rights holder for a variety of colleges, universities and other educational institutions across the U.S. The operating results of our Sports Marketing operating segment through June 30, 2020, are included in our Consolidated Financial Statements.
Basis of Presentation and Use of Estimates
The accompanying consolidated financial statements have been prepared pursuant to the rules of the Securities and Exchange Commission (the “SEC”). In the opinion of our management, the accompanying financial statements reflect all adjustments, consisting of normal and recurring adjustments, necessary for a fair presentation of our financial position, results of operations and cash flows for the years presented.
The preparation of our financial statements in conformity with accounting principles generally accepted in the United States of America (“GAAP”) requires management to make estimates, judgments and assumptions that affect the reported amounts of assets and liabilities, disclosure of contingent assets and liabilities at the date of the financial statements, and the reported amount of revenues and expenses during the reporting period. We base our estimates on historical experience and on various other assumptions that are believed to be reasonable under the circumstances, including the impact of extraordinary events such as the ongoing novel coronavirus (“COVID-19”) pandemic, the results of which form the basis for making judgments about the carrying values of assets and liabilities that are not readily apparent from other sources. Actual results may differ materially from these estimates under different assumptions or conditions, including the severity and duration of the COVID-19 pandemic.
The COVID-19 pandemic and the related preventative measures taken to help curb the spread, have had, and may continue to have, a significant impact on the global economy and our business. Given the uncertainty around the severity and duration of the COVID-19 pandemic and the measures taken, or may be taken, in response to the COVID-19 pandemic, the Company cannot reasonably estimate the full impact of the COVID-19 pandemic on our business, financial condition and results of operations at this time, which may be material.
Free historical financial statements for Outfront Media Inc. See how revenue, income, cash flow, and balance sheet financials have changed over 49 quarters since 2014. Compare with OUT stock chart to see long term trends.
Data imported from Outfront Media Inc SEC filings. Check original filings before making any investment decision.